

Overview
lineage_tools are the customer-visible lineage capabilities behind the Digital Twin and Context Graph experience in Genesis.
When Genesis uses SQLAlchemy metadata storage, including the Databricks App’s
PostgreSQL metadata database, it reads the saved embedding and LLM settings at
Twin startup and forwards usable runtime configuration to Twin. This lets
lineage indexing use those settings without requiring them to be re-saved after
startup.
What customers use them for
- viewing lineage-related context,
- exploring relationships between assets,
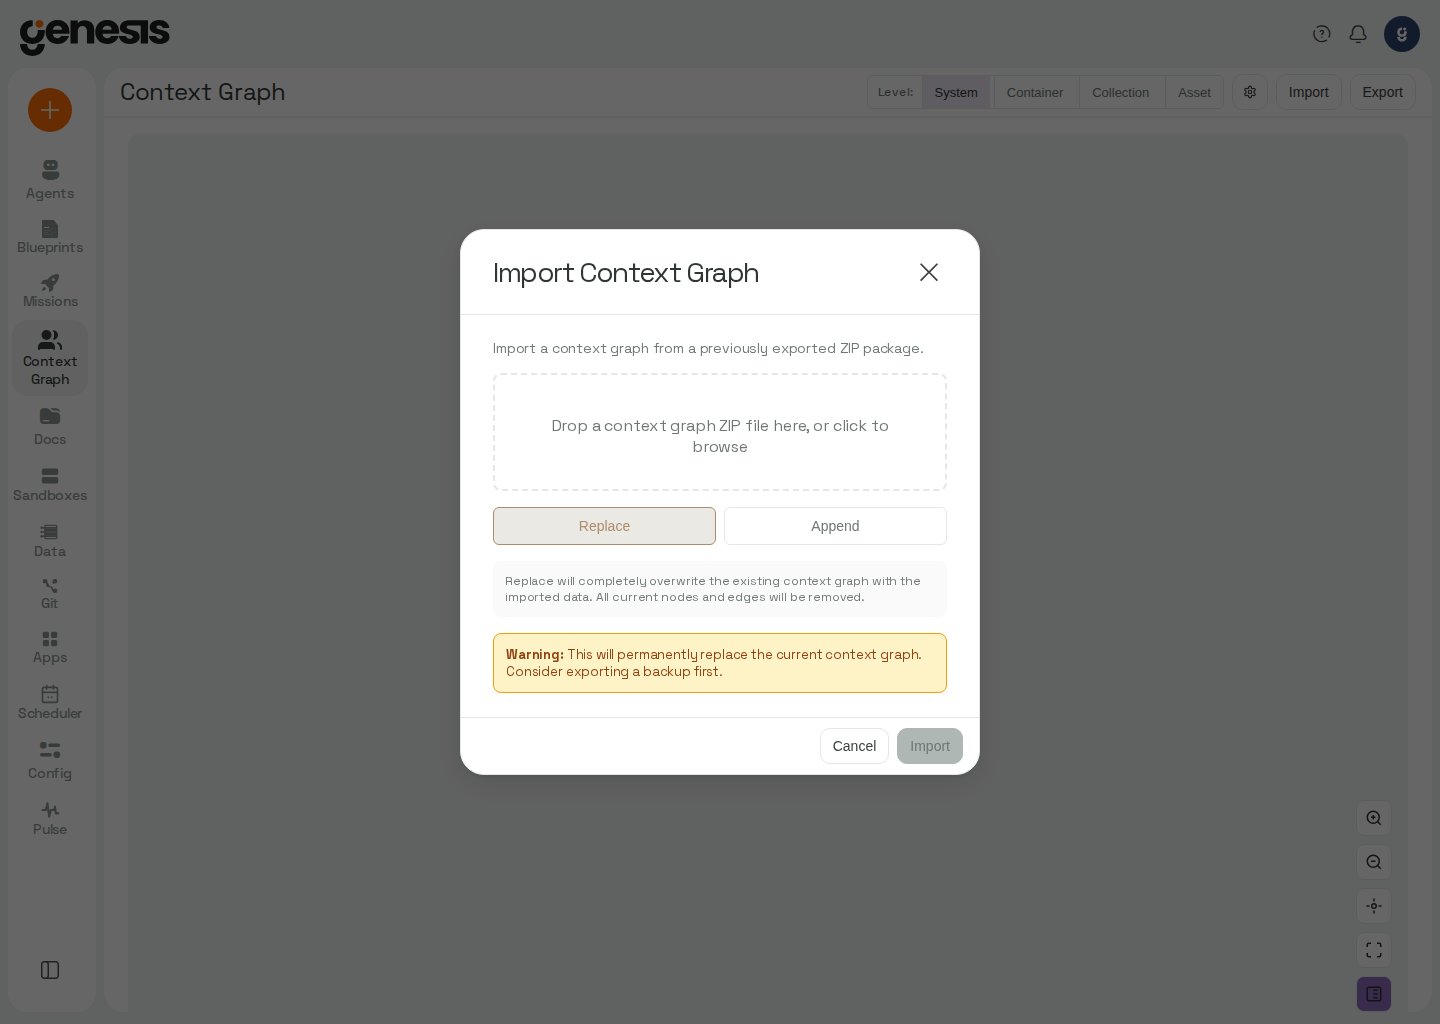
- importing or exporting context-graph data,
- supporting data-lineage discovery workflows.
Genesis dataset lineage
Genesis datasets are reconciled by the built-ingenesis source scanner rather
than written directly to Twin during dataset lifecycle operations. Creating a
dataset, changing its definition, or removing it queues a scan; Twin reflects
the change after that scan completes. Snapshot-only events (refresh,
ingest_snapshot, and rollback_snapshot) do not request a scan because they
do not change lineage. Twin deduplicates requests while a scan of that source is
queued or running.
Primary tool surface
lineage_action
Use lineage_action when an agent needs direct graph or index access beyond the higher-level search_data_context(...) wrapper.
On a Databricks App, changes made through
lineage_action are included in the Twin’s durable
volume snapshots. If startup could not restore the saved Twin data, a change response also
includes durability_warning; the change is not kept, and the saved copy is retried at the
next start. See Durable Twin data
for snapshot timing and recovery behavior.
For SEARCH_NODES, limit and offset also apply with compact=true. Compact results include count and nodes; when offset is greater than 0, the response also includes offset. A full page (count equal to limit) includes has_more: true and next_offset set to offset + limit; pass that value as offset to request the next page. The response only signals a continuation when the page is full, so a full final page can also carry these fields.
GET_PRODUCERS
Use GET_PRODUCERS to answer which active pipelines write a table or a
database/schema’s tables. It follows data_flow WRITES edges; read edges do
not make a node a producer. Pass exactly one scope: qualified_names (or one
qualified_name) for explicit nodes, or prefix for active table-like nodes
under a database or schema. Prefix matching uses the namespace’s normalized
casing. The query is read-only and uses indexed lookups sized to the selected
scope and its neighbors.
The response includes producers with each writer’s writes, other discovered
reads and writes_outside_scope, confidence and write evidence, plus
orchestrators; unproduced lists in-scope nodes with no active writer, and
unproduced_count preserves the full count if the list is capped. Orchestrators
are active actors connected above a producer by execution_flow or executes
edges. A top: true entry is not itself run by another active orchestrator.
include_orchestrators=false disables that walk. compact=true omits full node
properties and retains only producer grouping properties and compact write
evidence. max_nodes caps both growing lists (200 each when omitted), and
truncated reports the returned and total counts.
Usage accounting actions
UseGET_USAGE_CAP when a caller needs only the current global Context Graph
cap state, without the ledger totals and breakdowns returned by
GET_USAGE_SUMMARY:
{"success": true, "cap": ...}. The cap object contains
token_budget, budget_window_hours, reserved_in_window, remaining, and
exhausted. When no budget is configured, token_budget and remaining are
null and exhausted is false.
Use GET_USAGE_FACTS to read the Context Graph usage ledger at full fact grain.
By default it returns every fact in the requested hours window. Set
properties.limit to a positive integer to read one page instead; an omitted or
null limit keeps the unpaged response. A paged response includes facts and
next_cursor. Pass that cursor as properties.after on the next call to
continue strictly after the last fact. The cursor includes the full fact key:
bucket_start, source_id, call_type, operation, origin, scan_id, and
model. next_cursor is null when there are no more rows. Each paged call
reads at most limit + 1 ledger rows to determine whether another page exists.
Invalid limits or cursors return success: false with an error.
SET_USAGE_BUDGET to change the global cap. Pass properties.token_budget
as an integer token count; null removes the cap, while 0 blocks all
background work. Pass the optional properties.budget_window_hours as an
integer to change the window; when omitted, the existing window is retained,
or the first-ever setting uses the default 720 hours. The action returns
token_budget and budget_window_hours and requires access_config_panel.
Git repository actions
UseREGISTER_GIT_REPO to add a remote Git repository as a Context Graph
lineage source. Pass url and, when the repository requires a saved
credential, connection_id. To pin the source to a branch, pass the branch in
properties.branch; if omitted, Genesis resolves the remote default branch on
the first scan and records it. A repository URL supports one source, and its
branch is fixed at registration. Remove and register the source again to scan a
different branch.
LIST_GIT_BRANCHES to read the branches currently advertised by the live
remote rather than a cached clone. Pass the same url and optional
connection_id; the response includes branches and count. Each call makes
one network round-trip to the remote.
REGISTER_GIT_REPOS to register several repositories from the same saved
Git connection in one call. Pass connection_id and
properties.repos, a list of {url, branch?} entries. Each repository is
registered independently; the response separates registered repositories
from failed entries, which include the URL and error.
Source scope and scan records
REGISTER_SOURCE can register a scoped Power BI, Confluence, or Jira source. For
Power BI, pass properties.workspace_ids as a list of workspace IDs and
properties.workspace_labels as an ID-to-name object. When workspace IDs are
absent or empty, the source scans every workspace, including workspaces created
later. For Confluence, pass the selected comma-separated space keys in url
and properties.space_labels as a key-to-name object; an empty url scans all
non-personal spaces. For Jira, source_type is "jira" and connection_id
identifies the saved Jira connection. The optional string url (default
null) accepts comma-separated project keys; an empty value scans every
project, including projects created later. Pass properties.project_labels as
a key-to-name object to label selected projects in scan records. Omitted spaces
and projects are outside the scan, not deleted from the graph.
For a Genesis personal connection, register and scan only when the request is
made on behalf of that connection’s owner. Twin carries the registering user’s
identity into source validation and uses the source’s configured identity for
later background scans; Genesis still refuses credentials when that identity
does not match the owner.
Use UPDATE_SOURCE_CONFIG with source_id and properties to change a
registered source’s scope: workspace_ids and workspace_labels for Power BI,
space_keys (comma-separated) and space_labels for Confluence, or
project_keys (comma-separated) and project_labels for Jira. Empty
selections restore the respective all-resources behavior. A Jira connection
has one source; changing its project selection updates that source.
Scan status and history records include a scope snapshot for scans recorded
with scope support. It contains kind (power_bi_workspaces,
confluence_spaces, jira_projects, git_repository, or connection),
all, selected (an array of {id, label} entries), and patterns (the
applied connection pattern mode and list, or null when patterns do not
apply). Older records may not include scope. Power BI, Confluence, and Jira
scans limited to selected resources do not mark out-of-scope graph objects as
deleted.
Register a Jira connection with a project selection like this:
GET_STATS
Use GET_STATS for graph-wide statistics. Each requested storage count costs one
SQL query, so pass a field mask when a caller needs only a subset. For example,
Launchpad’s Context Graph readiness check can request only the node count:
stats. nodes_by_source is a
mapping of source-system scheme to node count. trie_nodes and
trie_data_nodes are derived trie counts; requesting either refreshes the trie
before the response is returned.
GET_INDEX_STATS
Use GET_INDEX_STATS to check whether the configured embedding identity is
working, not only whether the index contains documents. The response includes
the vector-index statistics plus embedding_provider, embedding_model,
embedding_status, and embedding_status_reason. The status is one of:
ok: embedding has succeeded and has not yet accumulated enough consecutive failures to conclude that it stopped working. The reason can still mention recent failures.unverified: no embedding call has been attempted, or too few calls have failed without a success to distinguish a transient provider error from a broken configuration.systemic_failure: the configured identity cannot currently embed, either because it never succeeded or because it succeeded and then stopped. In this state,SEARCH_INDEXresults degrade to graph-only lexical matching withscore: 0.0.unconfigured: there is no embedding client at all, so there is no identity to judge andembedding_providerandembedding_modelare empty.SEARCH_INDEXdegrades the same way it does undersystemic_failure. This is not a milderunverified— nothing has been configured to attempt a call.
embedding_status means the server is too old to report one, never that embedding
is healthy.
Always report embedding_status_reason verbatim, whatever the status. It
contains the evidence behind the verdict and the next diagnostic direction.
Manage scan scope
Uselineage_action with action="MANAGE_SCAN_PATTERNS" to read or update
the patterns and mode that define scan scope. A source uses one list in one
mode: exclude is default-allow, while include is default-deny. An empty
include list still scans everything. Databricks Unity Catalog sweeps honor the
source’s mode-aware matching; their runtime discovery remains exclude-list
based until that engine adopts mode-aware matching.
Patterns are globs over qualified names, not regular expressions. Prefix a
pattern with connection_id| to scope it to one connection; an unprefixed
pattern is global. For example, prod_sf|snowflake://ANALYTICS/* applies only
to prod_sf, while snowflake://STAGING_*/* applies to every source.
Pass the following keys in properties:
Validation is all-or-nothing: an invalid option or pattern applies none of the
request. Exclude patterns that name an unregistered connection are accepted
with a warning so sources can be configured before registration; include
patterns with an unregistered connection or scheme are rejected. Every
successful mutation records
changed_at, changed_by, action, source_key,
and detail in the scope audit history.
Every scope-changing request returns a match preview. preview is returned
when one source is affected; previews is returned when several are affected,
such as when an unprefixed pattern changes the global scope. Each entry has
source_key, mode, containers, objects, objects_total, and summary.
The counts are measured against all active graph objects, not only objects
owned by the named source. objects_total=0 means the graph has not been
scanned yet; objects=0 with a nonzero objects_total means the resulting
scope admits nothing. The preview reads every active graph node, so request it
when changing scope rather than in a per-object or scan-loop operation.
Compute node qualified names
Use the following qualified names withGET_NODE, GET_UPSTREAM,
GET_DOWNSTREAM, or SEARCH_NODES when inspecting compute discovered by a
Snowflake or Databricks lineage scan:
For example:
Connection-backed lineage schemes
Genesis flow scanners resolve the qualified-name scheme for SQL lineage and flow output edges through the canonical connection-type registry. This keeps references produced by different parts of a flow aligned. The relevant connection types include:
For example, a SQLite table referenced by a flow SQL step is emitted under a
genesis:// qualified name rather than sqlite://. Unknown non-empty
connection types use their lowercased type as the scheme; an empty connection
type uses unknown.
Snowflake task and pipe runtime facets
When a Snowflake connection is included in a Digital Twin lineage scan, Genesis maps runtime fields from the sameSHOW TASKS and SHOW PIPES metadata rows
onto task and pipe nodes. Task nodes expose warehouse, state, owner,
last_committed_on, schedule_raw, schedule_cron, and
schedule_timezone; pipe nodes expose owner and integration. Interval
schedules retain only schedule_raw, while USING CRON <expression> <timezone>
schedules also populate schedule_cron and schedule_timezone.
The scan also emits these runtime relationships:
Predecessor edges are emitted only when the Snowflake predecessor name is a
dot-separated identifier with no more than three segments. Malformed or
overqualified names are skipped instead of being partially parsed into a
plausible qualified name. In quoted segments, Snowflake’s doubled-double-quote
escape is decoded before the graph qualified name is created.
Task and pipe runtime fields and edges refresh on every scan sighting, including
when only the owner, schedule, state, warehouse, integration, or predecessor
list changes. The scan uses the metadata already fetched for object discovery;
it does not make an additional Snowflake request. If the connection has a
deployment declaration, the task and pipe nodes also receive their
deployed_in relationship. Use GET_NODE, GET_UPSTREAM, or
GET_DOWNSTREAM with the qualified names above to inspect these facets; filter
traversals with edge_types=["runs_on", "runs_as", "execution_flow"] when
needed.
GitHub Actions runtime facets
Git-backed lineage scans can emit runtime facets from GitHub Actions workflow YAML, including workflows that do not invoke a script. Uselineage_action to
inspect the resulting nodes and edges. Literal, source-resolvable declarations
are emitted; runtime expressions are skipped when their value cannot be known
from the workflow file.
Runner and principal identifiers are percent-encoded in qualified-name
segments so source identifiers containing separators remain distinct. For
example, an AWS role name containing
/ uses %2F in the principal QN while
the node’s name property retains the verbatim identifier. Runner label sets
are sorted and joined with +; runner groups use a group: prefix. Use the
qualified-name values returned by the graph rather than constructing them from
the display names.
For example, to inspect a runner node:
Use
GET_NODE for compact identity, summary, and neighbor pointers. When you
need the full indexed content for a node, such as DDL, SQL source, or other
indexed text, use GET_INDEX_DOCUMENT instead. Pass fields to
GET_INDEX_DOCUMENT when you need only selected metadata; the indexed text is
omitted and a metadata key that the document lacks is left out.REGISTER_SOURCE with source_type="talend" and project_path set to the local
project directory containing process/*.item. Do not pass connection_id for
this source type. Set scan_now=True to enqueue the scan after registration;
otherwise, the source is picked up by the normal Twin scan schedule.
If the project is also published to Genesis Git, pass
properties.git_repo_id and optionally properties.git_path_prefix to link
producer evidence to the job’s .item file. See Talend database lineage
for scanner behavior and unresolved-component details.
Register an Oracle connection with REGISTER_SOURCE, source_type="oracle",
and the saved connection’s connection_id. See Oracle in the Context Graph
for connection setup, scan-user grants, schema selection, and scan behavior.
Custom scanners (publishing extracted metadata)
After extracting structured metadata about data systems (tables, pipelines, jobs, schedules, connections), publish it to the Context Graph so it is searchable, traversable, and maintained. Do not store extracted metadata in ad-hoc tables or files — it will be stranded and invisible to other agents and users.1
Check or register a scheme
Call
lineage_action with action="LIST_SCHEMES" to see whether a namespace scheme already exists for the source system. If not, register one with REGISTER_SCHEME. Every scheme declares segment_levels — the semantic hierarchy level for each positional segment (container, collection, or asset). Use these levels to pick the right node_type for each segment and the right placeholder (<container>, <collection>, or <asset>) for unknown segments.2
Register the custom scanner
Call
lineage_action with action="REGISTER_CUSTOM_SCANNER", qualified_name="my_source_id", and properties={"bot_id": "...", "prompt": "...", "owns_scheme": "my_scheme", "schemes": [...], "description": "..."}. bot_id and prompt enable auto-triggered scans. owns_scheme (string or null) declares the single QN scheme this scanner is the authority for — it alone decides what still exists there during a complete scan. Omit it or pass null when the scanner owns nothing (for example a glossary that only publishes wiki pages). schemes is optional and informational only; it does not grant sweep authority.3
Start a scan session
Call
lineage_action with action="SCAN_SOURCE", source_id="my_source_id", and note the returned scan_id.4
Publish metadata
Use one or both patterns, always passing
scan_id:- Structured metadata (tables, pipelines, jobs):
BULK_ADD_NODES(includecontentfor searchability) andBULK_ADD_EDGES(READS/WRITES). Setproperties.edge_typewhen the relationship is not ordinary data flow: useexecution_flowfor orchestration or containment,navigationfor UI navigation,associationfor a loose semantic relationship,executesfor executor-to-code,runs_onfor executor-to-compute,runs_asfor executor-to-principal, ordeployed_infor a node-to-deployment-context relationship. An omittededge_typemeansdata_flow. - Document summaries (SharePoint docs, Confluence pages, knowledge articles):
UPSERT_WIKI_PAGEwithqualified_name,properties.title,content(markdown body), and optionallyproperties.subgraph_qnsto link to graph nodes. UseLIST_WIKI_PAGESwithprefixto enumerate existing pages. Publishing an existing page withUPSERT_WIKI_PAGEmarks it as written, taking ownership from a scan-generated page.
5
End the scan
Call
lineage_action with action="END_SCAN", qualified_name="<scan_id>". This triggers wiki relinking, estate regeneration, and vector indexing. Never skip this step. Pass properties={"complete": true} only when this run enumerated your entire owned scheme — Genesis then marks anything in that namespace you did not publish or touch, so dropped objects can be collected at cycle end. Omit complete for incremental or partial runs; marking is inert by default.Shared graph nodes and edges
When runtime discovery finds a qualified name that another lineage source already owns, it does not replace that source’s node or edge properties. Instead, runtime evidence is stored under theannotations.runtime_discovery namespace.
This keeps static metadata and runtime evidence together without allowing a
rescan by either source to erase the other source’s properties. Runtime-owned
nodes and edges continue to refresh their own properties on subsequent scans.
For Snowflake-native lineage hits, existing nodes are left unchanged and the
runtime signal is added to the shared edge when that edge belongs to another
lineage source. Use the Digital Twin and Context Graph guide
to configure source ownership and scan scope.
Snowflake runtime discovery also publishes inferred runtime bindings from
successful query activity. A runs_as edge connects the discovered tool to a
principal qualified name such as principal://snowflake/<NAME> when the
activity identifies a user or role. A runs_on edge connects it to the
existing warehouse node snowflake://_WAREHOUSES/<NAME>. These bindings are
last-known observations rather than declared configuration: a warehouse edge
is emitted only when the corresponding static warehouse node already exists,
and a complete runtime evidence fetch is required before stale bindings can be
reconciled. Use GET_UPSTREAM, GET_DOWNSTREAM, or GET_NODE with the edge
types runs_as and runs_on to inspect them.
Code-authored scanners
For structured or recurring sources, use a deterministic Python scanner instead of asking the agent to extract and publish records on every run. Store ascanner.py and its raw input in the bot’s Git-backed repository. Define a
transform(source) function that returns stable qualified-name nodes and
READS/WRITES edges, then define run(scan_id) to publish those records in
the active scan session. End the module with result = run(scan_id), using the
runtime-injected scan id:
transform() offline with a representative sample before publishing.
When run() publishes through genesis_sdk, call the SDK tool by its exact
name, lineage_tools_lineage_action; pass actor_qualified_name,
target_qualified_name, and operation for edges; batch node writes in groups
of 250 or fewer; and end the scan with
qualified_name=<scan_id> and properties={"complete": true}. Read repository
files from BOT_REPOS_PATH, rather than using absolute paths.
Register the scanner with a launcher prompt that tells the agent to read the
file and call execute_python_code exactly once with the full file as inline
code and a timeout of at least 300 seconds for large sources. Pass only
code: inline code runs top-to-bottom, and function_name/args are rejected
with inline code because they are only supported with script_path. The
scanner module calls run(scan_id) itself; inside the scan launcher,
from genesis import scan_id provides the active scan id. The launcher should
report the returned result and should not reimplement the scanner.
SCAN_SOURCE then dispatches that launcher for scheduled scans; after a run,
verify the result with GET_STATS or SEARCH_NODES.
For incremental scans, use GET_SCAN_STATE and SET_SCAN_STATE to persist bookmarks (for example timestamps or page tokens) between cycles. Publish new or changed records normally, remove deleted records with BULK_REMOVE_NODES, and use TOUCH_NODES for unchanged records that remain in an owned scheme. Omit complete from END_SCAN because an incremental run does not enumerate the whole scheme. Advance the bookmark only after END_SCAN succeeds.
If a scan cannot finish, call ABORT_SCAN with a reason instead of completing it. Check bulk-operation responses for failed items or errors before END_SCAN; use GET_SCAN_STATUS, GET_SCAN_HISTORY, and GET_SCAN_QUEUE to monitor sessions, and CANCEL_SCAN when an in-progress scan must be stopped. For a history check that only needs state, pass fields=["status"] to GET_SCAN_HISTORY; omit the mask when you need each scan’s full result and discovered names. Cancelling a queued scan removes it from the queue; cancelling an in-progress scan signals the scanner to stop at its next checkpoint and returns restart_required: false, so Twin can continue processing other scans. Use UPDATE_CUSTOM_SCANNER to change bot_id, prompt, owns_scheme, or description on an existing scanner. LIST_SCHEMES returns owner_source_id for each scheme when a scanner or built-in source owns it.
Scan-cycle result fields
The built-in Airflow, dbt Cloud, and Matillion scanners are enrolled scanners and return this scheduling answer and sweep report from each cycle. The result preservesreschedule_allowed separately from the older
queue_drained field: reschedule_allowed tells Twin whether another cycle
should follow, while queue_drained only reports whether the queue is empty.
This distinction lets a budget halt leave rescheduling as an operator decision
when work remains queued. Scan status and history retain the following report
fields when the scanner provides them:
The Airbyte, Fivetran, Microsoft Power BI, and SAP S/4HANA built-in scanners
use this model for object-shaped scans. A time-slice-limited cycle runs for at
most 30 minutes, then resumes from its durable object queue when more work
remains. A cycle can also stop because of a token cap, throttling, cancellation,
or an exhausted scan budget. Only a completed sweep runs stale cleanup; use
queue_remaining, sweep_status, and stop_reason to tell whether the source
is fully covered.
Use
queue_remaining with these fields to distinguish a completed sweep from
one that stopped with unread work still queued.
Databricks scan results may also include index_documents_repaired, the
number of unchanged objects whose missing search document was submitted to
the index worker, and index_repairs_not_attempted_on_budgeted_sweep, the
number of missing documents deferred because they needed a definition query
on a budgeted sweep. These counters are omitted when zero.
Power BI results include coverage.status (complete, partial, unavailable,
or not_requested) and the fields scanner_api, source_column_lineage,
visual_column_lineage, and dax_lineage. Source-column lineage is reported as
unavailable, visual-column lineage as unsupported, and DAX lineage as
explicit_qualified_references_only; warnings explains missing or incomplete
metadata. A complete object sweep does not mean all Power BI schema or lineage
metadata was available.
The built-in PostgreSQL, SQL Server and Oracle connection scanners use these
fields for their resumable database sweeps. They discover the selected estate on each
cycle and process objects from a durable queue in batches; a cycle that stops
before the queue drains reports that another cycle is needed. Stale-object
cleanup runs only after a complete sweep, so an interrupted cycle does not
retire objects it did not reach. PostgreSQL scans use the saved connection’s
SSL Mode; see PostgreSQL connection settings.
Twin cannot open a Lakebase connection that uses the Databricks App identity:
its per-connection credentials are minted by the Genesis server, not Twin. Use
a Lakebase connection configured with a password for lineage scans; see
Connections — Databricks Lakebase connections.
GET_SOURCE_SWEEP_STATUS
Read a registered source’s effective object-sweep budget and latest recorded
cycle outcome without retrieving scan history or queued object names. This
per-source summary remains available after per-sweep queue state is cleared.
The call costs up to five indexed SQLite lookups total: one source lookup and
up to four scan-state lookups.
effective_budget, last_outcome, and
budget_has_room_now. last_outcome is null until a cycle outcome has been
recorded; otherwise it contains the sweep_id, status, stop_reason,
recorded_at_utc, budget_at_outcome, budget_exhausted_units, spend,
queue_remaining, and objects_dropped for the latest recorded cycle.
budget_has_room_now is a boolean only when that outcome is HALTED for the
current, non-terminal sweep; it compares the current effective budget with
that outcome’s spend. It is null when there is no outcome or that check does
not apply. An unregistered source_id returns success: false.
custom_scanner_tools
Stateless helpers for the work a custom scanner does before publishing to the Context Graph. Nothing in this group reads or writes the graph — review the results, adjust qualified names to match your scheme, then publish with lineage_action (BULK_ADD_NODES, BULK_ADD_EDGES, and related actions).
analyze_sql_lineage
Call this when you hold SQL whose lineage should end up in the graph — view definitions, ETL queries, stored procedure bodies, or DDL dumps — and want to inspect what the parser infers before you publish.
On success, returns
nodes (qualified names with node_type), edges (each with actor_qualified_name, target_qualified_name, operation READS or WRITES, confidence between 0 and 1, and evidence), statements_parsed, and errors for statements the parser could not handle. Partial results are normal — one bad statement in a dump still returns lineage for the rest. If both nodes and edges are empty, check the dialect or pass actor_qualified_name for a bare SELECT.
Example
Nodes published with
content during BULK_ADD_NODES, and document summaries
published with UPSERT_WIKI_PAGE, are searchable through
search_data_context(...). For graph-based lookup when semantic search returns
no hits, use lineage_action with action="SEARCH_NODES".