

Overview
The Digital Twin page renders the Genesis Context Graph as an explorable graph. Users can inspect nodes, drill into aggregate groups, optionally browse Team Wiki in a side-by-side pane when wiki is enabled, import or export graph snapshots, and configure scans that keep the graph current.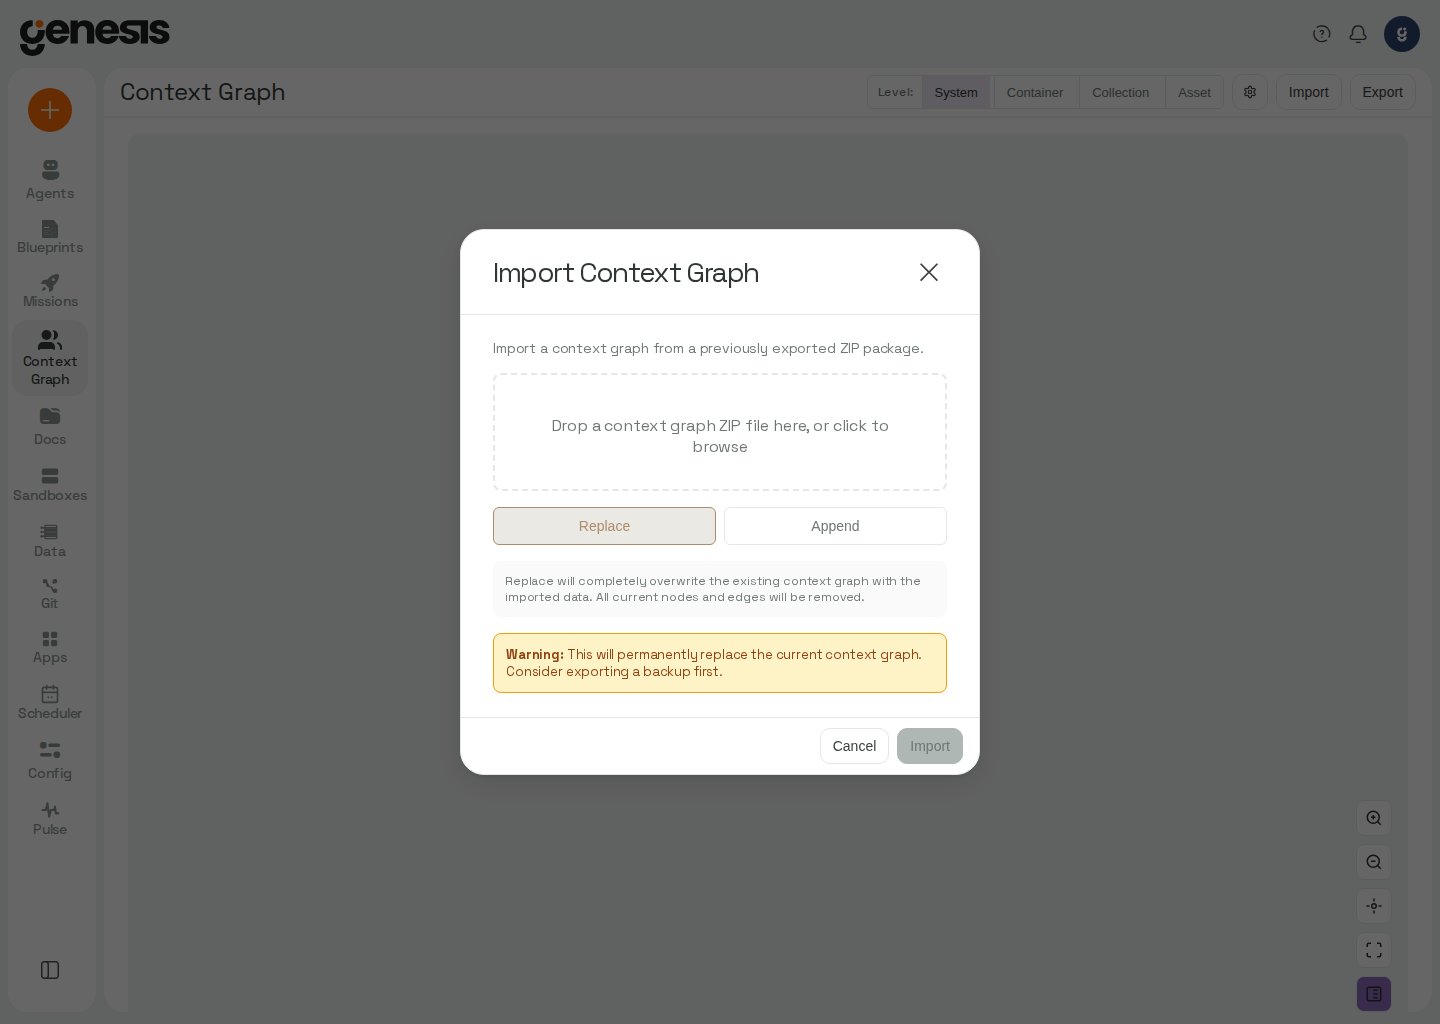
In auth-enabled deployments, opening Digital Twin requires
view_context_graph. Roles without that permission do not see the workspace
in the primary sidebar and cannot open the route directly.Build a Data Estate Health Dashboard
When the Context Graph contains at least one node, Launchpad shows Build Data Estate Health Dashboard. Select it to start thedata_estate_health_dashboard blueprint,
then provide the systems and sources, database/job/naming guidance, environment
exclusions, leadership priority, and pipeline-history availability for the
snapshot. The journey is hidden while the graph is loading, unavailable, or
empty.
The resulting dashboard is a point-in-time artifact with Trust, Cost
(Benefit), and Hygiene tabs. It uses graph-selected assets and reports
partial or unavailable evidence explicitly; a rerun creates a new snapshot
rather than replacing the previous one. For the mission’s capture bounds,
provenance, retention, and cleanup behavior, see the blueprint documentation.
What the graph shows
The graph helps users understand how repositories, database assets, notebooks, SQL scripts, dbt models, dashboards, reports, connections, compute resources, and related Genesis entities connect. Depending on what has been scanned, this can also include datasets, apps, schedules, skills, blueprints, missions, agents, Flows, and SAP S/4HANA OData entity types with navigation-property lineage edges between them. Power BI scans can add dataset table, column, and measure nodes, report-to-dataset and dataset-to-dataflow edges, and measure dependencies supported by explicit table-qualified DAX references. They can also add dataset-to-Snowflake-table-or-view Data Flow edges from supported source expressions, so a report can trace through its dataset to a Snowflake object. The parser followsSnowflake.Databases navigation and literal SQL in Value.NativeQuery over a navigated database or schema; it does not execute the expressions. Unresolved parameters, native SQL that cannot be assigned a schema, and conditional reads do not produce table links. Incomplete source evidence does not remove earlier links; complete evidence removes stale source-expression links. Without Scanner API expression metadata, only database-level placeholders remain. Power BI still does not infer physical source-column or report-visual mappings. See Power BI setup for the metadata settings required for these links. Git-backed scans can add GitHub Actions workflow nodes and, when the workflow YAML contains literal source-resolvable declarations, runtime facet properties and Executes, Runs On, Runs As, or Deployed In edges in addition to links from workflows to invoked scripts. Snowflake runtime discovery can add inferred Runs As edges to observed users or roles and Runs On edges to observed warehouses. Lineage edges can represent Data Flow, Execution Flow, Navigation, Association, Executes, Runs On, Runs As, or Deployed In relationships; typed relationships use distinct colors and dash patterns so data movement, orchestration, and runtime bindings can be distinguished at a glance. When the legend is open, Genesis lists only the edge styles present in the current graph alongside the node color key. The page includes a semantic zoom or level selector, node drill-down, node detail panels, import and export controls, and scan configuration. See GitHub Actions runtime facets and Shared graph nodes and edges for runtime edge details.
Genesis dataset lineage appears after the built-in genesis source scan
completes. The events that queue that scan, and snapshot events that do not,
are documented in Genesis dataset lineage.
For sample-database availability in a Databricks App, see
Genesis as a Databricks App.
At narrow widths, the graph toolbar wraps its controls, and the search field can shrink without its placeholder overlapping the semantic-level selector.
Source nodes use the registered connection’s existing logo when Genesis can resolve their provenance. Generic Git nodes use a repository link or registered source metadata to identify GitHub, Bitbucket, or GitLab; when no source identity can be established, they retain the generic node appearance. Genesis assets use the Genesis group artwork at genesis://, while SQLite assets under genesis://sqlite retain SQLite provenance, including virtual connection and dashboard groups without object metadata. When an asset identifies an object type such as database, schema, table, view, connection, or group, the graph uses a compact object icon and the node tooltip shows the source and type separately (for example, SQLite · Table).
Exact App assets are rendered as screenshot cards using the protected /api/apps/{app_id}/thumbnail endpoint after a usable thumbnail loads. The complete App title appears below the card at normal zoom rather than inside the screenshot. Apps with thumbnail_hidden: true, aggregated App nodes, and App child nodes do not request a preview; while a preview is loading or unavailable, the graph shows a compact circular App icon with the App title below it. At zoomed-out scales, the graph may hide node labels to keep the visualization readable.
The graph can also show display-only hierarchy links between Genesis groups and their contents. These dashed Contains links have no arrow or particle animation and are separate from Data Flow lineage; they describe the visible hierarchy and are not written to lineage storage.
For Airflow sources, each discovered active DAG includes its file location and available schedule metadata. When the schedule can be normalized, the graph records a five-field cron expression and, when supplied by Airflow, its timezone; DAG owners appear as shared Airflow principal nodes connected with Runs As edges. When a DAG file location resolves to a configured Git repository, the DAG is connected to its repository file with an Executes edge.
For Snowflake and Databricks lineage sources, scans can also add account- or workspace-level compute nodes. Snowflake warehouses use qualified names such as snowflake://_WAREHOUSES/<NAME>; Databricks SQL warehouses use databricks://_SQL_WAREHOUSES/<ID>, and clusters use databricks://_CLUSTERS/<ID>. These nodes contain structural and configuration properties; cost and usage metrics are kept in the estate cost records keyed by the node qualified name. See Lineage Tools for lookup examples.
For Databricks jobs and pipelines, authoritative scans reconcile runtime bindings with the declarations currently returned by Databricks. When a job no longer reports a runs_as identity, or a job or pipeline no longer has a deployment declaration, the corresponding Runs As or Deployed In edge is removed from the graph. A degraded job discovery result does not treat missing task details as proof that task-derived bindings were removed.
Work with large graphs
Digital Twin applies the same density budget to every graph size. Before an asset-level fetch, Genesis checks the total asset count and, for an active drill scope, the count under that qualified-name prefix. Asset-level materialization fetches at most 4,000 nodes in one graph payload; an over-budget asset request is materialized at the coarser collection level instead. The count check is held until the required count is known, so a large graph is not fetched speculatively. Graph fetches stop after 120 seconds and show an error with guidance to drill into a system or container or use search if the request still exceeds the limit. When the fetched graph contains more than 500 nodes, Genesis keeps the highest-signal connected nodes and collapses the remainder into per-parent aggregate nodes, rolling those groups up the hierarchy only as needed. The density banner reports exact shown, total, and aggregated counts; no nodes are silently truncated. Double-click an aggregate to expand that subtree in place at the current level, or use search to reach a specific asset. Graphs within the budget use the normal view without densification.Inspect a node
Clicking a node opens a detail overlay on the graph with labels, type, links, qualified name, and available properties. For Databricks table nodes, column comments appear beneath their column names and types when Unity Catalog provides them. SAP CDS view entity names that follow the standard layer-prefix pattern (for exampleA_BillingDocumentItemType) are formatted for display as [A] BillingDocumentItem — a single-letter layer prefix in brackets, the CamelCase entity body, and an optional Type suffix stripped. Genesis also writes the node’s qualified name to the page URL as ?qn=..., which keeps graph selection and the optional Team Wiki side pane in sync when wiki is enabled. Closing the detail overlay clears ?qn; when the wiki pane is open, the viewer returns to the Data Estate home page (wiki://estate). For Flow nodes, the available properties can include step count, schedule configuration, and recent run status when Genesis has that data. For grouped nodes, Drill Down (or double-click) opens a narrower view at the next semantic level. Genesis records that drill in ?level= and ?drill= so a refresh, a shared link, or the browser Back button restores the same filtered picture.
Navigate the graph with URL state
The Context Graph viewer keeps your place in the address bar. Three optional query parameters control the view:
Double-clicking an aggregate node, choosing Drill Down, or asking the Twin chat panel to drill into a node advances to the next semantic level and records both
?level= and ?drill= in the URL. Opening a system from the System view goes directly to its asset graph; later drills advance one level at a time. A plain visit to a graph containing exactly one drillable system opens that system’s asset graph automatically, replacing the initial view in browser history. This skip applies only to the initial plain System view; manually selecting System or clearing the drill still shows the system graph. Drill navigation creates a browser history entry, so Back undoes the drill. Picking a different level from the level selector also creates a history entry and keeps the active drill, showing that subtree at the newly selected resolution; clear the drill filter from the page header to remove it.
Node clicks update ?qn= without adding a history entry, so Back steps through drill levels rather than undoing every selection. When Genesis automatically switches level to focus a wikilink or ?qn= deep link, it updates the URL in place without adding a history entry.
Launchpad journeys can open Digital Twin with a friendly connection name in ?drill= (for example ?drill=my_snowflake). Genesis resolves that to the canonical qualified name and matching level on load; opening a drillable system from the System view goes directly to its asset graph. The active drill chip shows the target’s last path segment, or the scheme’s display name for a system-root target (for example, Palantir Foundry for palantir_foundry://). Clearing an active drill filter from the page header also removes ?drill= from the URL so a refresh does not restore the filter.
Browse Team Wiki alongside the graph
When Team Wiki is enabled for the deployment, the page toolbar includes a Wiki toggle. The wiki pane is closed by default so first visits show the graph only; Genesis remembers whether you left the pane open or closed in the current browser. Open the wiki pane to show the same WikiBrowser workspace used on the standalone Wiki page: Data Estate as the default landing page (wiki://estate), a static Reference caption, then collapsible folders for Topics (wiki://... generated flow and warehouse-group documents) and Scanned sources (human-labeled connection roots such as Snowflake and BigQuery). Scan-generated pages retain their generated status when re-evaluated, backfilled, or relinked. Scanned sources opens expanded by default so deep-linked entities stay visible; clicking the folder label toggles expansion only and does not change the current page. When no graph node is selected, the viewer opens Data Estate instead of showing a blank pane. The graph stays on the left and the wiki pane on the right, with a draggable divider between them (default split 50/50). On desktop, each pane has a maximize control to temporarily hide the other pane; press Esc or use its restore control to restore a maximized pane. Closing the wiki pane resets any maximized state.
Selection stays synchronized through the ?qn= URL parameter when a graph node or wiki page is active (see Navigate the graph with URL state above for ?level= and ?drill=). Clicking a graph node, picking a page in the wiki tree, following a wikilink, or choosing a wiki result in the Twin search bar all update ?qn. With no selected node or wiki page, the pane follows the active drill target when one exists; otherwise it shows Data Estate (wiki://estate). Graph-backed qualified names also focus the matching node when it appears in the current view; selecting a deep entity from the wiki tree switches the graph to the matching semantic level when needed. wiki://... selections stay in the wiki pane without forcing graph focus. Data Estate summarizes the customer’s scanned inventory with Overview (when Twin can call an LLM, a headline and key points), Areas (generated wiki://... component docs grouped by category, including pages for connected warehouse schema groups), and Systems (links to system containers from the Context Graph); the default section order is Overview, then Areas, then Systems. Genesis built-ins are not listed as the customer’s estate: a system or container holding only built-in artifacts is omitted, while paths containing customer content remain visible. When systems have been scanned but no component pages (topics) exist yet, Overview explains that it is synthesized from topics; topics can be created by code or document scans, eligible database scans, or an agent publishing a page. When no systems have been scanned, Genesis instead shows the page-level connection guidance. Database wiki pages are generated after a complete lineage scan; by default, a source’s first pass can write up to eight pages and later passes up to two. Set the source config key wiki_page_budget to override the per-pass limit (maximum 20; 0 disables page generation). Larger sources may need additional completed scans to process all eligible groups. A connected warehouse pipeline of up to 16 schemas can be documented on one page; larger connected groups are treated as hubs and documented one schema at a time. When there are more flows than fit in the prompt, flows between schemas in the group are supplied first. Wiki pages render standard GitHub-flavored Markdown (headings, tables, task lists, fenced code blocks, external links). Graph-backed pages can list Related topics when scans have generated wiki://... entries for the entity. For graph-native pages, Genesis renders the main body first and loads the Children section progressively underneath so large container nodes open faster; synthesized hierarchy pages can still include Children inline.
If Twin is unavailable while Genesis loads the Wiki discovery list or related topics, the pane keeps that lookup distinct from a genuinely empty result. Retry after the Context Graph service recovers rather than interpreting an empty document list as proof that no Wiki documents exist.
Operators with the access_config_panel permission see an Edit Layout button on Data Estate (wiki://estate) in the wiki pane (Digital Twin side pane and the standalone Wiki workspace). In layout edit mode, drag section chips to reorder them, hide sections to remove them from the rendered page, or add hidden sections back from the palette. Save Layout persists the shared template for all viewers (at least one section must remain visible). Reset discards unsaved changes. Layout changes apply deployment-wide, not per user.
If a wikilink or ?qn= deep-link target is not found at the current semantic level, Genesis switches to the level implied by the qualified name’s path depth (for example genesis:// → system, snowflake://ANALYTICS_DB → container) before falling back to asset for schemes where the path heuristic under-counts. When the target still cannot be resolved at asset level, Genesis shows a toast that the qualified name is not in the current graph view and suggests using the search bar.
The Twin search bar can also return Team Wiki pages alongside graph nodes. Wiki results show a wiki badge and set ?qn to the page or subgraph document instead of selecting a graph node, so you can jump from search into wiki content after opening the wiki pane.
Import, export, and refresh
Use Import to load a ZIP snapshot in replace or append mode. Use Export to capture the current graph for handoff or archival review. Configure scans when you want Genesis to refresh the graph from supported sources on a schedule. If import, export, or graph browsing is unavailable because the server was started withNO_MCP_SERVERS=true, the operation reports that Context Graph
requires the Twin MCP server. An administrator must restart Genesis without
NO_MCP_SERVERS to use these features.
The page header also includes a clickable scan-status banner. When a scan is running or queued, the banner shows current activity and opens scan details. A Context graph spend gauge icon opens /digital-twin/spend; when the global token budget is exhausted the icon turns red and its tooltip reads token budget exhausted. For progressive Git scans, the banner can show cumulative files scanned / files discovered counts and the active cycle number instead of only a percentage. Airbyte, Fivetran, Microsoft Power BI, and SAP S/4HANA scans can also span multiple cycles; use the scan details to distinguish remaining queued work from a completed sweep. After a scan finishes, recent successful scans appear as completed, while recent failed scans appear in an error state so you can distinguish failures from successful completions at a glance. When a scan was driven by a custom scanner bot, the scan detail panel can also show a Thread field with a link to the chat thread that ran the scan (opens in a new tab). When Pulse -> Jobs turns Twin harvest (master) off, the same banner switches to a warning state and links back to Pulse -> Jobs so operators can see why scans are quiet.
For agent-driven checks of a registered source’s latest object-sweep outcome and
effective budget, use GET_SOURCE_SWEEP_STATUS with lineage_action. See
Lineage Tools for the
response fields and example.
Twin re-evaluates wiki pages from graph nodes and edges that actually changed during the scan. A rescan that leaves the graph unchanged does not repeat completed subgraph extraction; pages that have never been extracted, were edited since their last attempt, or had a failed extraction remain pending and are retried even when the scan finds no graph changes.
When Twin’s LiteLLM Proxy request receives 401 for its bearer credential, Twin
refreshes its LLM credentials from Genesis and retries the request once. If the
proxy also rejects the refreshed credential, Twin pauses further refresh attempts
for that credential for 60 seconds to avoid repeatedly requesting a token during
wiki relinking. This recovery is automatic and requires no additional setting.
Operators with the access_config_panel permission also see a Logs button in the scan-status modal header. It opens the Scanner Log viewer for twin.log. Genesis stores that file on durable storage alongside the context graph database ({STORAGE_PATH}/twin/twin.log by default; TWIN_LOG_FILE overrides the path), so scanner output survives pod restarts. Log rotation is bounded to retain multiple days of high-rate scanning without unbounded disk growth. The viewer loads the last 2,000 lines, refreshes every five seconds, highlights [ERROR] and [WARNING] lines, supports a case-insensitive line filter, auto-scrolls new output when you are at the bottom, and can download the full log file.
Monitor context graph spend
Scan progress answers whether a job is running. Context graph spend answers what scanning and search have cost, where tokens went, and how much capacity remains under the global cap — questions operators usually ask when nothing is running. Genesis exposes this on its own page at/digital-twin/spend rather than inside the scan-status modal. The page requires the same view_context_graph permission as the main Digital Twin viewer.
Use the window selector in the page header to scope totals and breakdowns to 24h, 7d, 30d (the default), or All time. Three summary cards sit above the controls:
Below the cards, users with
access_config_panel can set or clear the global token budget. Enter a token count and click Set budget to apply a cap for the configured window (shown as Token budget per Nh window; the default window is 720h — 30 days — when a budget is first established). Click Remove cap to lift the limit entirely (token_budget becomes unset). If you enter a budget lower than what is already reserved in the current window, Genesis warns that background scanning stops immediately. Users without this permission do not see the cap editor. If Genesis cannot verify the permission, the page shows a retry control instead of allowing a cap change.
Use Scanner model tier to choose which chat-model tier Twin uses when writing scan descriptions: Fast, Main, or Frontier. The dropdown shows the effective model for each tier on the active provider (for example Fast — haiku-4-5). Lower tiers cut scan cost; higher tiers produce richer descriptions. Changes take effect on the next scan without a server restart. The setting is stored as llm.twin_scanner_model_tier (default fast) and requires access_config_panel to change. When provider credentials refresh, Twin continues to resolve the scanner runtime from this setting, so Cortex scans stay on the selected scanner tier instead of reverting to the provider default.
Breakdown tables list spend By source, By operation, By origin, and By call type. Each row shows measured tokens; when reserved spend is present, a +… reserved suffix appears beside the measured total. Internal ledger keys such as _unattributed and unknown display as Other; estate-wide search appears as Across sources. Spend over time plots hourly buckets for the last seven days so you can spot runaway scans while they are still running. When nothing has billed yet in the selected window, the chart notes that only reserved spend is present so far.
The global cap applies to background Twin work (scheduled and manual scans, auto-cycling harvest, and similar). User-originated work is metered in full but is not refused when the cap is exhausted, so a scan that uses the budget does not break interactive search. When a finite budget is spent in the rolling window, capacity returns automatically as older hourly buckets roll out of the window.
Configure lineage sources and scans
Digital Twin scans only the sources that you explicitly register as lineage sources. Saving a supported connection on the Connections page does not add it to the Context Graph automatically. The exception is the built-in default Iceberg connectioniceberg.genesis_iceberg: when it is available in your deployment, Genesis auto-registers it unless it has been explicitly removed. Supported connection types in Twin Config currently include GitHub, GitLab, Snowflake, Databricks, SQL Server, Oracle, Iceberg, Microsoft Power BI, SAP S/4HANA, Confluence, Jira, Google Workspace, SharePoint, Airflow, dbt Cloud, and Matillion. Genesis can also surface eligible entries under Local Repositories for Git repositories on the server that do not have a remote origin. Talend and Informatica PowerCenter are path-based sources rather than Connections entries: register them with lineage_action using REGISTER_SOURCE and project_path; Talend uses its project directory containing process/*.item, while Informatica uses one XML export or a directory of exports. See Lineage Tools for the tool parameters and PowerCenter integration for sidecars and lineage details.
For Jira scanning in Digital Twin, see the Jira scanner guide.
Power BI metadata is fetched during each registered source scan. The Scanner API
processes up to 100 workspaces per batch, polling every 30 seconds within a
five-minute metadata deadline for each batch. Review scan details and history for
metadata coverage and warnings separately from sweep completion; see
Scan-cycle result fields.
Configure the enhanced metadata tenant settings on the saved connection’s
Power BI setup.
Talend database lineage
When a Talend project is registered as a lineage source, scans inspect database components in each job’s.item file and publish READS and WRITES edges for
tables identified by component table parameters or embedded SQL queries. This
lets GET_PRODUCERS report
Talend jobs that load a table. Parameters that depend on runtime-only values
cannot always be resolved; those components are reported on the job as
unresolved_db_components rather than guessed. For Git-backed .item file
evidence, see the Talend registration notes.
Airflow, dbt Cloud, and Matillion lineage sources use resumable object sweeps. Each cycle discovers the source objects, then processes them in batches through a durable queue; a large estate can therefore take several cycles to finish. The scan-status modal and scan history show the sweep status, remaining queue, coverage, projected time, and stop reason. Stale-object cleanup runs only when the sweep completes, so a cycle that stops because of its time slice, cancellation, provider throttling, or a configured budget does not mark objects it has not reached as stale. A throttled provider ends the current cycle at a checkpoint rather than recording the source as a failed scan.
- Open the scan configuration modal from the Digital Twin page.
- Review the current entries under Lineage Sources. Click Custom Scanner to register a bot-driven scanner that publishes metadata into the Context Graph. Provide a Scanner Name (for example
bdt_matillion), select the Bot that runs the scan, choose Owns Scheme (the namespace this scanner is the authority for, or None — creates no nodes of its own when it only anchors edges or publishes wiki pages into other schemes), enter the Prompt instruction sent when a scan cycle starts, and an optional Description. Only unclaimed schemes appear in the Owns Scheme list; a scheme can have at most one owner. Custom scanners appear in the lineage source list; click one to edit its bot, prompt, owns-scheme selection, or description (the scanner name cannot be changed after creation). For code-authored scanners, the launcher prompt must pass the full scanner file as inlinecodeonly; see Code-authored scanners for the required self-invocation pattern. - Under Connections, add each supported source that you want to include. For GitHub and GitLab connections, use Select repos. For Snowflake, Databricks, and SQL Server connections, use Select databases to choose which databases to include. For Microsoft Power BI, use Select workspaces; for Confluence, use Select spaces; for Jira, use Select projects. Oracle, Iceberg, SAP S/4HANA, Google Workspace, SharePoint, Airflow, dbt Cloud, and Matillion connections use Add source to register the connection without a resource picker.
Connections saved with User OAuth authentication appear in the list but their Add and Select repos actions stay disabled. Scheduled scans run headless (typically 2:00 AM) and need a long-lived credential that does not depend on an active user session to refresh. The disabled control explains that scheduled scans require a long-lived credential. Interactive chat and connection tests can still work with User OAuth; only Context Graph lineage registration and scans require a PAT, GitHub App, or another non–user-OAuth auth mode. For GitHub App connections, Twin mints an installation access token when a scan needs Git credentials and reuses it while it remains valid. Configure the required
app_id,installation_id, andprivate_keyfields in the saved GitHub connection; see GitHub connections. Personal connections (scope="personal") also appear in the list but their add actions stay disabled in this picker. For owner-authorized registration throughlineage_action, see Lineage Tools. Each connection row includes a shield (Check scan permissions) control. Click it to resolve the connection credentials and run Twin’s permission audit for that source. Results show individual checks withpass,fail, orwarnstatus plus a summary — useful before registering a shared Snowflake or GitLab connection as a lineage source. When you select a GitHub or GitLab repository, choose the Branch to scan from the branch selector. The list is fetched from the live remote when you open or focus the selector, and the repository default is marked (default). If you leave the selector untouched, the default branch is registered. The selected branch is fixed when the source is added; it is shown on the registered source and cannot be changed later. To scan another branch, remove the source and register the repository again. If the selected branch is deleted or renamed on the remote, the scan fails rather than scanning a different branch. - If Local Repositories appears, click Add for each local git repository that you want to include. This section lists eligible Git repositories on the Genesis server without a remote origin. Genesis-managed system repositories are excluded from the list. Repositories that are already registered show Added. Local repositories must have complete Git history: shallow clones are rejected before a scan bundle is built. Re-clone without
--depth, or rungit fetch --unshallowin the existing clone, then retry the scan. If cloning still fails, the scan error includes the actionable Git failure rather than only Git’s advisory output. - For Snowflake, Databricks, and SQL Server lineage sources, click Select databases to choose which discovered databases to include in lineage scans. If a SQL Server connection was saved with a blank
Databasefield, Genesis discovers all accessible databases on that server before you apply the selection. For Snowflake and Databricks sources, clicking Apply also recordsexclude_future_databasesfor that source using the current timestamp. This locks the selection to the databases that exist at that moment, so databases created later stay excluded from future scans until you apply a new selection. Snowflake lineage scans also refresh task and pipe runtime facets, including schedule, state, owner, warehouse, integration, and predecessor relationships. Invalid or overqualified predecessor names are skipped instead of creating partial graph edges; see Snowflake task and pipe runtime facets for the validation rule and graph fields. Snowflake scanner statements are automatically labeled inQUERY_HISTORY; see Identify Twin scanner queries when you need to separate scanner traffic from customer queries. Snowflake scan scope includes databases granted to the connection’s primary role or to roles granted to it, at any depth. It includes databaseUSAGE,OWNERSHIP, andIMPORTED PRIVILEGESgrants, plusUSAGEon database roles. Databases visible only throughPUBLICor secondary roles are not scanned. Check scan permissions resolves this same scope and reports the visible databases it finds. The check may report an incomplete scope if it reaches its 60-second walk budget, the 500-role limit, a 1,000,000-row grant-list cap, or cannot read an inherited role’s grants; the scan has no 60-second budget, but it shares the role and row caps. If the primary role’s grants cannot be read, Genesis fails closed and scans no databases rather than falling back to the account-wide list. Re-run the scan afterSHOW GRANTS TO ROLEsucceeds; a failed cycle does not remove existing graph data. - Use Excluded from Scanning and the schedule controls to refine how Genesis refreshes the graph. Exclude patterns apply to runtime lineage as well as static object discovery. When a runtime lineage hit references an excluded endpoint, or an endpoint inside an excluded container, Genesis drops that hit and does not mint a node or edge for it. Endpoints that are merely outside the scanned scope remain eligible for the normal unknown-endpoint behavior.
- Under Schemes, review the qualified-name namespaces that custom scanners and other publishers use (for example
snowflake://,gitlab://). Each scheme row shows whether it is unowned or swept by a specific lineage source (built-in connection or custom scanner). Built-in schemes are read-only. Click Register Scheme to add a custom namespace, or click a scheme marked Custom to edit or delete it. When registering or editing a scheme, set:- Scheme Name — lowercase letters, digits, and underscores only; part of every qualified name and cannot be changed after registration.
- Path Shape — Fixed (exact segment count), Variable (unbounded path depth), or Flat (a single segment).
- Segments — for fixed-depth schemes, choose 2–5 segments.
- Segment Labels — names for each path segment, mapped to the context graph hierarchy (
container,collection,asset). Variable-depth schemes use three labels (container / collection / asset template); flat schemes use one. - Casing — Preserve, Uppercase, or Lowercase normalization when building qualified names.
- Description — optional human-readable note.
Deleting a custom scheme removes its registration; existing
scheme://nodes stay in the graph but lose casing normalization and segment validation.
read_api scope; if membership listing fails, the repo picker may show
only personal projects even though the connection test succeeded.
Sources listed in Lineage Sources are included in both scheduled and manual
scans. If you remove a lineage source, future scans stop using that source until
you add it again. If a Jira scan is active, Genesis rejects source removal; wait
for it to finish or cancel it, then retry. For the effect of Jira source removal
on indexed issue search, see the
Jira scanner guide.
For queued or in-progress sources, the scan-status modal now includes an Auto toggle. When Auto is on, Genesis keeps auto-cycling that source until the current progressive file queue drains. Turning Auto off does not cancel the current cycle; it lets the in-flight cycle finish and then stops re-enqueueing the next cycle. The same modal surfaces cumulative files scanned / files discovered progress and cycle counts when that data is available.
For Databricks, PostgreSQL, SQL Server, and Oracle sources, one cycle may cover only
part of the selected estate. The modal and scan history expose the sweep
outcome so you can tell whether another cycle is needed. For PostgreSQL,
see Connecting To PostgreSQL
for database-sweep behavior and PostgreSQL connection guidance; the same cycle
and completion reporting applies to SQL Server. For Oracle grants, schema
selection and incremental rescans, see Oracle in the Context Graph.
For Databricks document repair during scans, see Databricks scan behavior.
SQL Server lineage scans inside a Databricks App use the bundled FreeTDS driver
and the same TLS behavior as other SQL Server connections; see SQL Server
connections.
Scan details and history preserve the scanner’s sweep outcome, including the
stop reason, coverage, dropped-object count, and whether another cycle is
allowed. For the complete result-field reference and the distinction between
reschedule_allowed and the older queue_drained field, see Scan-cycle result
fields.
Scan details also show the scope recorded when the scan started: all resources
or the selected resource names, and any applicable connection-pattern mode and
count. Older scan records may not include scope.
Choose Cancel in the scan-status modal to stop a queued or in-progress scan. A queued scan is removed from the queue. An in-progress scan stops at its next checkpoint; for Snowflake sources, Genesis also aborts the active Snowflake statement server-side. SQL Server statements running through pymssql in a Databricks App have no server-side abort primitive and finish on SQL Server after the scan stops waiting. Cancelling a scan no longer restarts Twin, so the worker can continue with other queued scans. Snowflake scan details can show the planned database count, databases completed, current database, and objects indexed when that progress data is available.
During Snowflake rescans, Genesis verifies each fetched object’s DDL against the
stored DDL hash before reprocessing it. Unchanged tables, views, procedures, and
functions are counted as unchanged and do not undergo another embedding pass.
When only the rendered Snowflake timestamp changes, Genesis updates the stored
timestamp while still skipping reprocessing. Quoted Snowflake object names keep
their source spelling while qualified names are normalized for graph matching,
so a rescan does not create duplicate nodes or mark an existing object stale
solely because of identifier casing.
Pulse -> Jobs includes Twin harvest (master), a global on/off switch for
Twin harvesting. It is off by default (jobs.twin_harvest.enabled=false).
When it is off, scheduled twin_daily_scan,
per-connection auto_twin_harvest triggers, Scan All, and per-source
manual scan actions stay paused. You can still open Twin config, update
sources, and save schedule or exclude-pattern changes while the switch is
off. For the permission that controls whether the scan-status banner can
report this state, see Pulse Jobs controls.Use graph nodes in chat
Customers can reference Context Graph nodes directly from chat by typing@, then entering search text to look up databases, notebooks, dashboards, repositories, and other indexed nodes.
Search prefers semantic-index hits first, but it can also fall back to graph-only matches when the index does not return a good candidate. Graph-only matches are an unscored lower tier; see Context Tools for the scoring and filtering contract. Returned matches can stay tied to a specific connection_id. When possible, Genesis cross-checks that identifier against the live connection registry so a removed or unreachable connection is not advertised as bound. connection_binding_status can be bound_unmeasured, bound, bound_unreachable, bound_inaccessible (the connection exists but you have not been granted access to it — ask a Genesis administrator), bound_removed, or unbound; tool responses may also include connection_status and connection_reachable when the registry was consulted. Listing connections does not open them, so bound_unmeasured is the ordinary answer and connection_reachable is omitted for it — its absence means nothing was measured, not that the connection is unreachable.
If semantic results consistently degrade to graph-only matches, inspect the
semantic_index block in the search response first: it says whether the vector
store or embedding client is missing. See Context Tools
for the enablement settings and response details; you can also use
lineage_action(action="GET_INDEX_STATS") to distinguish a transient failed
embedding attempt, a systemic embedding failure, or an install with no embedding
client configured. See Lineage Tools
for the status values.
When the same search contract is surfaced through tool or MCP automation,
Genesis also returns stable result_id values plus a pagination block so
follow-on calls can page or reference results without relying on display order.
For index-coverage details, including connections that no scanner can read, see the
Context Tools response contract.
When a chat search result includes column_names, treat them as a preview; every
name is a whole identifier, but column_names_listed and column_count distinguish
the names shown from the asset’s declared width, and a column_names_partial: true
result may omit columns. ddl_available reports whether the asset has retrievable
DDL even when the preview does not show it. Use describe_asset for the complete
schema before concluding that a column is absent. See
Context Tools for the
response contract.
Genesis inserts a friendly @DisplayName in the composer, resolves that selection to the underlying fully qualified node when the prompt is sent, and keeps the conversation view readable without exposing the underlying node reference or system metadata in chat.