

Overview
The Metrics page is the customer-facing configuration surface for metrics collection and reporting behavior.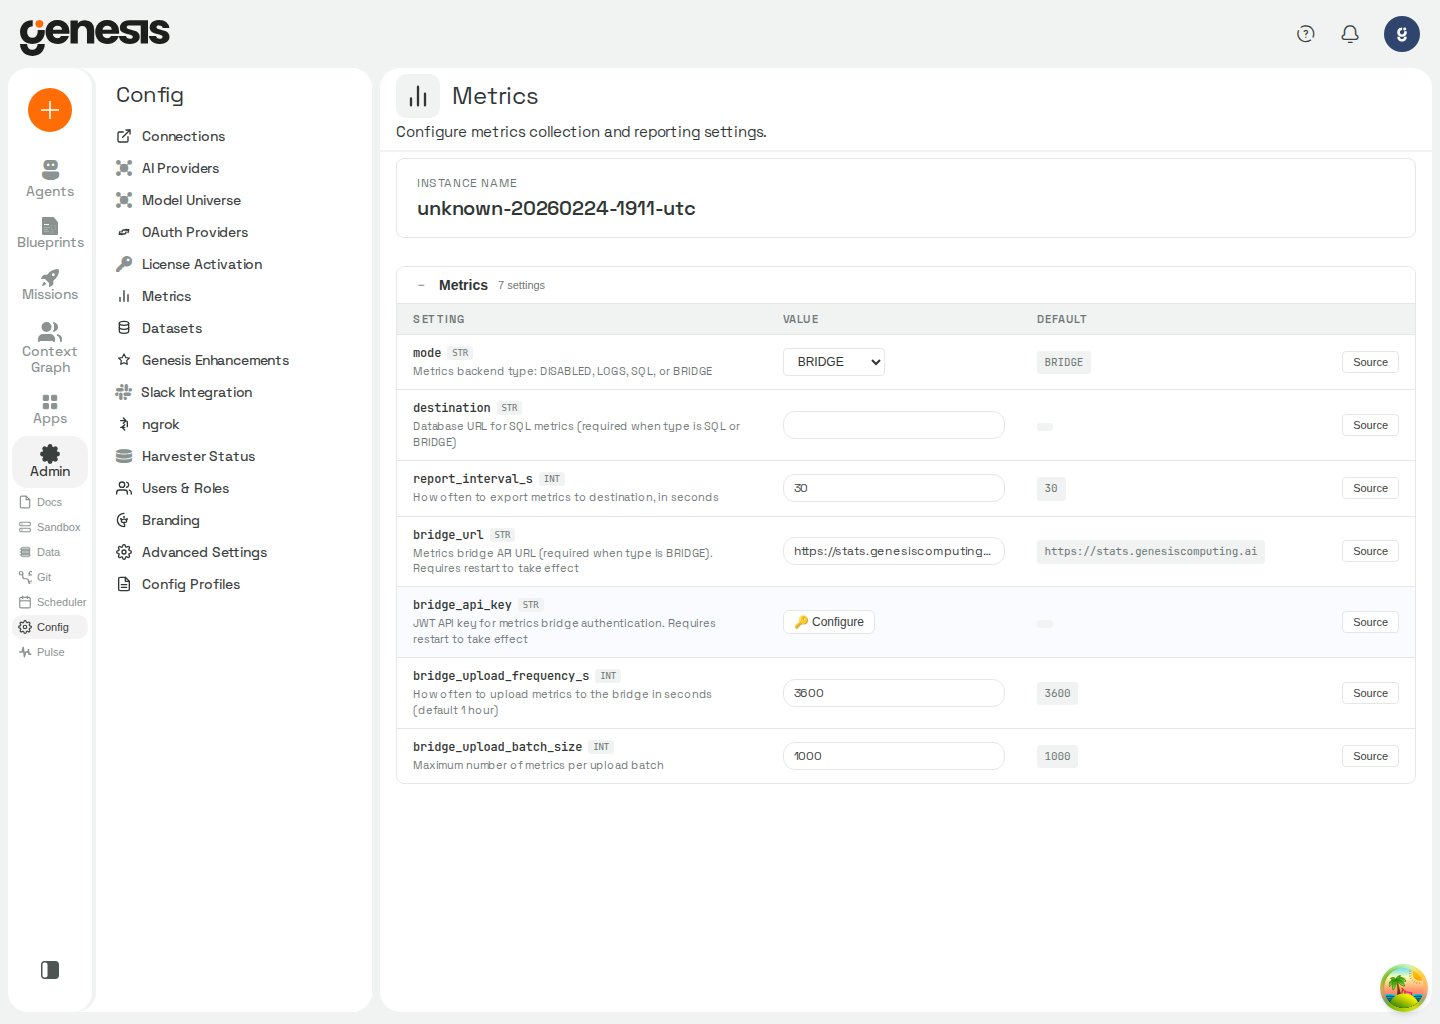
What customers configure here
- the metrics mode,
- destination or bridge settings,
- reporting interval,
- upload frequency,
- related metrics credentials or configuration values.
Environment-specific behavior
Some deployments show additional instructions or approval actions when external metrics delivery requires extra configuration. In Snowflake / SPCS bridge-mode deployments, the page can show Approve External Access and Assign to Genesis controls for outbound metrics delivery. After you trigger those actions, Genesis rechecks the assignment immediately and updates the section in place as soon as the external access integration is confirmed.OTLP export
Genesis can export metrics directly to any OpenTelemetry-compatible collector — Prometheus, Datadog, Grafana Cloud, New Relic, Honeycomb, Splunk Observability, OpenObserve, and so on — over the standard OTLP/gRPC or OTLP/HTTP transports. This path is configured separately frommetrics.mode, so you can run OTLP on its own or alongside the
existing logs, SQL, or bridge pipeline.
Configuration
For
grpc, Genesis performs a short startup availability check against
the configured endpoint before enabling OTLP export. If the collector is
unreachable, OTLP export is disabled cleanly and Genesis continues
running. Set OTEL_METRICS_FORCE_ENABLE=true only when you need to skip
that preflight (for example, when the collector starts after Genesis).
Restart required. All
observability.metrics.* settings are read
once at startup. After changing any of them — including enabling OTLP
for the first time, swapping the endpoint, or rotating an auth header —
restart Genesis for the change to take effect.Headers and authentication
observability.metrics.headers follows the W3C OTLP header convention:
a comma-separated list of key=value pairs. The exporter
URL-decodes each value before sending, so any character that is awkward
to store in a flat config field (spaces, commas, =, etc.) must be
percent-encoded.
The single most common gotcha is the space inside Bearer tokens:
the Genesis Secrets UI strips literal spaces from values to prevent
accidental copy-paste damage, so you must enter the space as %20.
You can also store the entire header string in the Secrets panel
and reference it from
observability.metrics.headers — the exporter
resolves secret-backed values before parsing.
What gets exported
Every data point Genesis exports carries a globalinstance attribute
identifying the Genesis instance (set via server.instance_name or
GENESIS__SERVER__INSTANCE_NAME). The OpenTelemetry instrumentation
scope name is genesis.metrics. Counters are exported with delta
temporality (each export carries the increments since the previous
export, not a cumulative total). Gauges are sampled at export time.
Hosted Try Me instances also add a tryme_instance attribute to every
metric row, set to the instance’s Fly app name. This is present when demo
mode and demo.provisioner_url are configured and FLY_APP_NAME is set;
it is omitted from laptop mode and other installations.
Gauges (point-in-time values)
purpose values: user_chat (interactive chat), scheduled_job
(scheduler-driven), blueprint (blueprint execution), handoff
(delegated work), unknown, or * (total across all purposes).
Counters (delta-exported)
LLM counter attribute values:
model— literal model string the request was sent with (e.g.gpt-5,claude-sonnet-4-6,cortex-claude-sonnet-4-6);"unknown"if the response did not include it.provider—openai,anthropic,cortex,litellm_proxy, etc.;"unknown"if not reported.bot_id— agent identifier associated with the LLM call. Use this dimension to attribute LLM usage and cache misses to a bot. Thread identifiers are not exported as dimensions; per-thread cost remains in the thread’s ownthread_stats_v1aggregate.execution_origin(only present for proxied / classified calls) — for exampleinteractive_user,scheduled_background,handoff_initiated,blueprint_runtime. Lets you separate human-driven cost from background-automation cost.credential_type(only present for proxied calls) — for exampleapi_key,service_account,oauth_user.
Privacy
user_idis irreversibly hashed before being attached to any metric. Genesis generates a per-deployment salt the first time it starts; your collector receives an opaque 32-character hex token, not the raw user identifier. The salt never leaves the host.- No prompt content, completion content, or tool arguments are exported as metric attributes. Only metric values, counter increments, and the attribute fields listed in the tables above.
- The
tool_nameandbot_idattributes are emitted as-is and may appear in your collector. If you treat bot or tool names as sensitive, scope your collector’s data retention accordingly.
Verifying it works
After enabling OTLP and restarting Genesis, look in the server logs at startup for one of these messages:
When endpoints are logged, Genesis automatically strips credentials
(
user:pass@) and query tokens from the URL before logging, so it is
safe to share these log lines for troubleshooting.
Thread health probe log lines
Genesis emits single-lineTHREAD_HEALTH_PROBE records in server logs to
correlate slow threads without enabling debug tracing. Search logs for that
prefix, then filter by phase=:
Each line uses stable
key=value segments (for example thread_id, bot_id,
compression_event_count, dur_ms). Values with spaces are JSON-escaped.
Thread message reads also emit THREAD_MESSAGES_FETCH records. The import_ms
field reports the worker’s import duration in milliseconds to one decimal place;
it is - when that timing is unavailable or invalid. The record also includes
snapshot, formatting, RPC, and total-duration timings when available.
Suggested first dashboards
Metrics-mode combinations
When OTLP export is enabled, Genesis combines it with the selectedmetrics.mode instead of replacing that mode:
DISABLED: OTLP onlyLOGS: logs plus OTLPSQL: logging plus SQL storage, and OTLP when enabledBRIDGE: logging plus SQL storage, scheduled bridge uploads, and OTLP when enabled
metrics.mode is SQL or BRIDGE but metrics.destination is missing,
Genesis keeps logging plus OTLP enabled when OTLP is configured instead of
turning metrics off completely.
metrics.report_interval_s controls the SQL exporter cadence. OTLP uses
its own observability.metrics.export_interval_s — the two can be set
independently.
Managed deployment attribution
For managed installs, the control-plane installer setsmetrics.deployment_id
to attach the deployment identifier to SQL-backed metric records as
attributes.deployment_id in SQL and BRIDGE modes. The setting is a string
that defaults to ""; an empty value adds no attribute. It does not add the
identifier to LOGS metrics or OTLP output. Restart Genesis after changing the
setting.
Cost reporting behavior
When Genesis renders LLM cost reporting, it uses the normalized usage fields stored on assistant messages. Cache-aware models report separateinput,
output, cache_read, and cache_write costs, and reported
billable_input excludes both cache_read_input_tokens and
cache_creation_input_tokens.
Related pages
- Tracing — OpenTelemetry distributed traces, configured the same way
- Pulse Monitoring
- Advanced Settings