> ## Documentation Index
> Fetch the complete documentation index at: https://docs.genesiscomputing.com/llms.txt
> Use this file to discover all available pages before exploring further.
# Pulse Monitoring
> Monitor platform health, jobs, datasets, downloads, metrics, user information, and operational telemetry from the Pulse workspace.
## Overview
**Pulse** is the operational monitoring suite inside Genesis. It brings live system health, background jobs, downloads, datasets, metrics, slots, and user info into a single workspace.
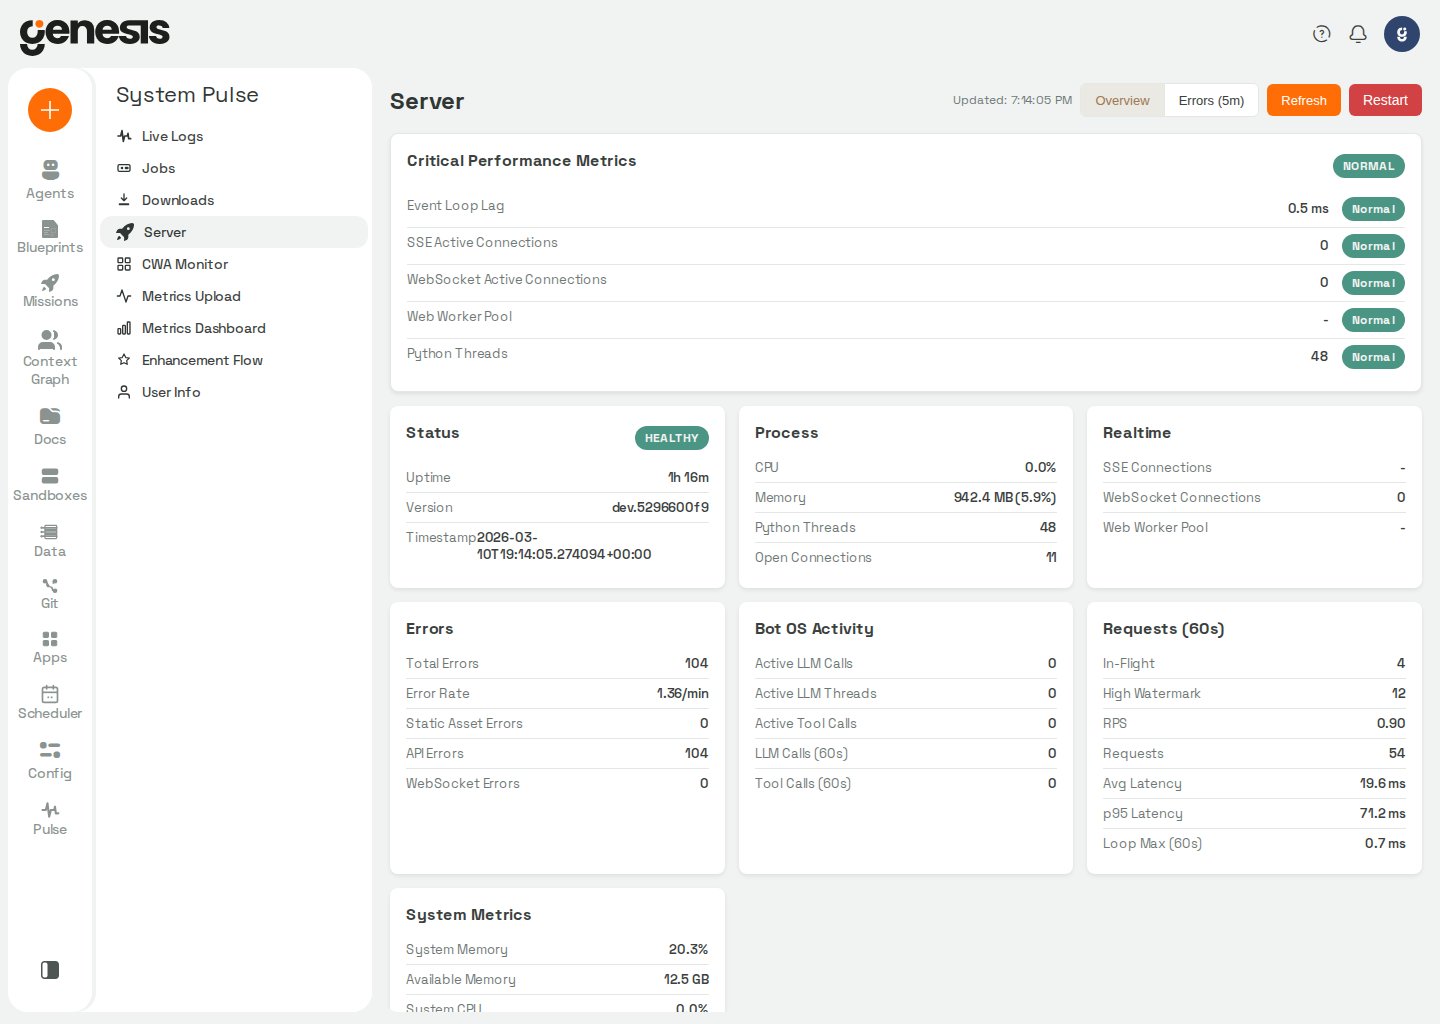 ## Main Pulse views
| View | Purpose |
| - | - |
| **Live Logs** | Stream and filter runtime logs. |
| **Jobs** | Review grouped background jobs, toggle them on or off, and pause Twin harvest globally. |
| **Downloads** | Inspect generated or downloaded assets. |
| **Server** | Check process, memory, health, and request metrics, and use the guarded restart action when your role allows it. |
| **CWA Monitor / Slots** | Review operational capacity and active workload slots where enabled. |
| **CLI Workspaces** | Monitor per-user CLI terminal workspaces and, with the required permission, restart or cancel one. |
| **Metrics Upload** | Verify bridge-upload cadence and destination settings. For Databricks restart durability and destination caveats, see [Durable SQLite stores](/docs/deployments/Databricks/Genesis-On-Databricks#durable-sqlite-stores). |
| **Metrics Dashboard** | Review higher-level usage and performance trends. |
| **Agent Scorecard** | Review agent-grading KPIs, trend charts, workflow breakdowns, and backfill classification runs. |
| **Agent Learning** | Review recurring steering-pattern candidates, accept or dismiss learnings, measure post-adoption improvement, and browse the adoption ledger. |
| **Mission Value** | Compare observed completed-mission time with manual duration baselines and review adoption ROI coverage. |
| **Costs** | Review this instance's spend, data quality, activity and execution drilldowns, retained call evidence, and spend controls. |
| **User Info** | Inspect current user-related operational info. |
| **Genesis Enhancements** | Review support and enhancement summaries plus dormant-review health. |
In OAuth- or OIDC-protected deployments, the **Live Logs**, health, **Server**,
and **CWA Monitor / Slots** views use your current signed-in UI session for
protected fetches and live streams. That includes health checks, recent-error
queries, log streaming, and the guarded restart action. The **Server** view and
its runtime telemetry (`GET /api/health/detailed`,
`GET /api/health/server-panel-telemetry`) require `access_config_panel` when
auth is enabled. The **CWA Monitor / Slots** view loads the full agent-slots
payload from `GET /api/admin/slots`, which also requires `access_config_panel`.
If a Pulse Server request returns `403` without an `X-Request-Id` response
header, Pulse identifies it as a proxy or firewall blocking the request before
it reaches Genesis, rather than a Genesis permission denial, and shows the API
path. A `403` with the header is reported as a Genesis permission denial and
includes the returned error detail when available.
The **Metrics Upload** card tracks scheduled bridge-mode uploads. Direct OTLP
metrics export is configured separately on [Metrics](/docs/Setup/Metrics) and
does not use the bridge upload queue. After two consecutive job-level upload
failures (each job attempt already retries three times), bridge uploads pause
for one hour. Each subsequent failed attempt doubles the pause, up to 24 hours;
uploads resume automatically after the backoff, and a successful upload clears
the failure streak.
For bot-attributed LLM usage and prompt-cache miss telemetry in exported
metrics, see [Metrics](/docs/Setup/Metrics).
## Costs
Open **Pulse → Costs** (`/pulse/costs`) to review the serving instance's spend
and what caused it. The page is available on every install to a signed-in user
with Pulse panel access. It shows "Recording since" the moment this install
began recording spend; a window that starts earlier shows "No data before" that
moment and is clamped to it. Until the cost data's indexes are built (the first
quiet window after an upgrade) the page says "Preparing cost data" and shows no
figures.
Pulse → Costs is the supported cost investigation page; the built-in Cost &
Usage Dash app is optional for older workflows. Metrics Dashboard continues to
show Messages, Users, and Tokens. A saved link to its former Cost tab opens
Pulse → Costs.
Choose a **24 hours**, **7 days**, **30 days** (the default), or **6 months** reporting
window. The summary includes spend-over-time and token-use charts, alongside
the statement that distinguishes known priced spend from unpriced usage,
reserved Context Graph tokens, incomplete attribution, and rows outside the
instance total. Known priced spend counts only calls with a catalog price. A call
at an estimated price (default rates because the model has no catalog price, or a
price whose source was not recorded) is reported on its own **Estimated price**
line, with its dollars and request count; it is
never added to the known priced total. Unpriced usage is a count, never $0. A
freshness panel identifies whether chat or Context Graph producers are current,
stale, preparing, failed, disabled, or unsupported. While cost data is being
prepared the page checks every 60 seconds, then refreshes the summary and spend
controls every 30 seconds while the page is visible. Activity and execution
drilldowns remain paused until figures are ready. An up-to-date Context Graph
rollup with no recorded usage says nothing has been recorded since the store's
recording cutover, or that nothing has been recorded yet when no cutover is
available; it does not report an unknown or stale state. When an activity
contains only tokens reserved against the Context Graph cap and no requests or
measured usage, its cost appears as **reserved only**, not `$0\`. If the install
has no configured name, Costs omits its generated fallback identifier from
empty-state and spend headlines.
The statement can open the **Written while cost accounting was off**,
**Arrived after their day was sealed**, and **Revised after their day was
sealed** lines to their ledger records. Showing those records requires
`access_config_panel`. The first two lines describe records outside the total;
the revised-after-seal line shows the latest revision while the total keeps the
value counted when the day was sealed. The gap ledger is not split by instance,
so its records can include other instances on a shared store. Records load a
page at a time. See the [Costs API
reference](/docs/Genesis-API/API-Reference#internal-cost-accounting-endpoints)
for the response fields and access requirement.
The **Breakdowns** section splits spend by source or activity group, model,
agent, provider, pricing quality, attribution quality, operation, origin, and
call type. Operation, origin, and call type use the summary's grouped figures;
their tables load separately from the other breakdowns. Select a breakdown row
to filter **Activity detail**; select another chart bucket or breakdown row to
change the detail, or clear the filters to return to the full window. Chart
bars show hourly or daily buckets depending on the selected range. Click a
bucket, or choose one from the bucket picker and select **Show activities**, to
scope Activity detail to that bucket. These selections are kept in the page URL
and remain in effect after a reload. Activity-based breakdowns can be partial
while more activity rows or model entries remain to be loaded.
Genesis AI model rows are labeled **Genesis AI** (or by their Genesis AI role)
instead of exposing the underlying model identifier. Their pricing source is
shown as **Genesis AI**, not as the upstream rate catalog used internally.
Expand an activity in **Activity detail** to see its executions inline, then
expand an execution to inspect retained **Calls**. Activity rows show known
priced spend, quality qualifiers, execution count, last-seen time, and whether
the activity is recurring. See the [Costs API reference](/docs/Genesis-API/API-Reference#internal-cost-accounting-endpoints)
for the `true`, `false`, and `null` meanings of the recurring indicator. Where
available, links open the scheduled job, Digital Twin source, or scheduler run
history. Unattributed spend can appear as separate chat and Context Graph
activity rows; expanding either row drills into only that producer's executions
and evidence. When a detail filter is active, the expanded activity lists the
cost records behind its filtered amount instead of runs; an execution count
may still include all runs of the activity rather than only runs within the
filtered spend. Without filters, an activity with no run started in the
selected window shows its cost records for that window, since there is no run
to expand. If the activity list and its records resolve the selected time
window at different moments, Costs warns that their windows differ and offers
**Re-read** to fetch them together.
Calls show compact call or hourly Context Graph evidence. Call details include
cache read/write token counts, and Context Graph bucket details include
reserved embedding tokens. A dash means a count was not recorded, not that it
was zero. Calls can be complete, partial, or expired; an expired execution
keeps its summary even after raw call evidence passes the retention boundary.
When you select a Context Graph source activity, the execution list also shows
that source's sweep status. This on-demand Twin read shows the effective
per-source limits (or that the source is unbounded), the latest recorded sweep
outcome and stop reason, exhausted budget units, and whether a halted sweep has
room under the current budget. When usage was recorded, the panel also shows
the sweep's total active time, objects, queries, and containers across its
cycles, with configured limits alongside the corresponding usage. It labels
totals for an in-progress or halted sweep as used so far; those sweeps may
continue. Before any outcome is recorded, the panel says the source has not
been scanned; if Twin cannot provide the status, it marks the source
unavailable. The source activity's known priced spend appears with the sweep
details. See the [Costs API reference](/docs/Genesis-API/API-Reference#internal-cost-accounting-endpoints)
for the response fields.
The **Spend controls** panel shows the Context Graph background token cap and
per-agent budgets. **Adjust cap** edits the same cap as the Digital Twin spend
page; a blank cap means unlimited background scanning, while `0` blocks all
background scanning. The page also links to the Digital Twin editor. If the
cost-accounting rollup job is enabled, its default interval is
`jobs.cost_accounting_rollup.interval_seconds=300` seconds, so newly written
facts can take up to the next rollup pass to appear in the totals. The initial
rollup wait is separate from this interval: the page checks for readiness every
60 seconds until the first rollup is ready, then refreshes the figures every
30 seconds while the page is visible.
## CLI Workspaces
Open **Pulse → CLI Workspaces** (`/pulse/cli-workspaces`) to monitor the running
workspaces created by the direct CLI terminal. The view is available when
`cli_terminal.enabled` is `true` (the default is `false`) and the signed-in user
has `view_sandboxes`. The list refreshes every 10 seconds and shows each
workspace's owner, status, age, CPU, and memory. When the Kubernetes metrics
server is unavailable, live resource usage is shown as unavailable while the
configured limits remain visible.
Users with `manage_sandboxes` can restart or cancel a workspace after confirming
the action. Restart deletes and recreates the workspace pod; cancel deletes the
pod. In both cases, the user's volume and saved sessions are kept, and a new
workspace is created on the next connection. The page also displays the
Genesis CLI connection command for the server being viewed.
## Mission Value
Open **Pulse → Mission Value** (`/pulse/mission-value`) to review the current
deployment instance's completed-mission volume and manual-versus-Genesis time.
The page requires `view_all_missions` and Pulse panel access. Choose a 30-,
90-, or 365-day reporting range, optionally filter by normalized work type, and
page through the mission drilldown. The report is read when the page loads or
its filters change; it is not a scheduled background refresh.
The page shows exact, estimated, and incomplete observations; candidate and
filter counts; work-type shares; cycle, lead, human-wait, and signed-savings
totals; and the percentage of observed missions covered by a manual baseline.
Signed saved work is manual baseline minus Genesis cycle for exact,
baseline-covered missions, so negative values remain visible. A mission's
quality details are available in the drilldown.
Configure manual baselines and their environment-override behavior in [Mission
Value settings](/docs/Setup/Advanced-Settings#mission-value-settings).
Work type is derived from `blueprint_name`, then `project_type` as a fallback;
renaming either value changes grouping and baseline matching. The current
baseline is applied retroactively to matching exact missions in the selected
range. For the HTTP contract, see [Mission Value endpoints](/docs/Genesis-API/API-Reference#mission-value-endpoints).
The **Live Logs** view subscribes to the live stream and then loads recent
history. Genesis queues any matching lines that arrive during that bootstrap
window and emits them once after the historical batch returns, which avoids
missing or duplicated lines as the stream connects.
Live entries now carry contextual attribution when Genesis can resolve it. In
practice that means you can filter or inspect logs by bot, thread, tool,
origin, phase, request, user, or module path instead of relying only on the
message text. Slack lifecycle, warning, and error events are also forwarded
into the same log stream, so Slack reconnect activity stays visible in Pulse.
## Genesis Enhancements summary
The **Genesis Enhancements** Pulse card now includes a compact dormant-review
summary alongside the ticket lifecycle counts. It shows the dormant-review
scheduler `status`, the current mode (`dry-run`, `drafts`, or `scan-only`),
queued review count, generated draft count, failure count, and the latest
reviewed-thread total from the most recent run.
Use the link in that card to jump back to **Config -> Support and
Enhancements** when you need to change `dry_run`, `create_drafts`, or the
saved scheduler settings. The card refreshes every 15 seconds, so it is a
quick operator view rather than the full configuration surface.
## Agent Scorecard
Open **Pulse → Agent Scorecard** (`/pulse/agent-scorecard`) to review how
agents are performing under the agent-review grading pipeline. The page
requires Pulse panel access (`access_pulse_panel`) and is active only when
agent review is enabled for the deployment. When it is disabled, scorecard
requests return `404` and the page shows a disabled-state message with a link
to **Config → Advanced Settings → Agent Review**. Other request failures show
the normal load-failure message.
Use the header controls to scope the view:
| Control | Purpose |
| - | - |
| **Agent** | Select which bot's classified threads to score. Genesis defaults to the first agent that has classified data. |
| **Workflow type** | Filter to one workflow type or **All workflow types**. |
| **Filters** (slider icon) | Set the date range (**Last 7 days**, **Last 30 days**, **Last 90 days**, or **Custom** with a date picker) and granularity (**Day** or **Week**). The default range is the last 30 days. |
When data exists for the selection, Genesis shows KPI cards, trend charts, a
workflow breakdown table, and a backfill panel.
### KPI cards
| KPI | Meaning |
| - | - |
| **First-shot success** | Share of tasks completed without steering corrections, weighted across **full**-policy rows only. Shows **—** with a note when the selection is graded under **corrections only** and first-shot is suppressed. |
| **Steering turns / task** | Average steering turns per classified task across all grading policies. |
| **Threads classified** | Sum of per-bucket thread counts across the selected window. |
| **Known priced spend** | Sum of chat-call costs priced from the catalog. Spend that Genesis recorded at an estimated price, such as a model priced at default rates because it has no catalog price, is not in this total: when estimated spend or requests are present, it is shown beneath the KPI as **Estimated price** with its request count, as on the Costs page. Calls without a price or with missing pricing details are excluded and listed beneath the KPI. When the selection has no catalog-priced calls, the amount is shown as unavailable rather than as `$0`. |
| **Feedback** | Counts of user **met** and **not met** thumbs from [chat expectation-met feedback](/docs/User-Guide/Chat-And-Threads#expectation-met-feedback). |
### Trend charts
Genesis plots time-bucketed series for first-shot success rate, steering
turns per task, known priced spend (USD), latency (p50 and p95), tool error
rate, and user feedback (**Met** / **Not met**). When the price split includes
estimated spend or requests, that spend is plotted as its own **Estimated
price** series beside known priced spend.
Unpriced or unknown-price calls do not contribute to spend. If no calls have a known price, the chart
explains that there are no priced calls; if a bucket has no model-call records
or its cost data is unavailable, the chart says cost is unavailable.
First-shot charts show a suppression message instead of a line when every
bucket in the selection is **corrections only**.
### Workflow-type breakdown
The breakdown table lists each workflow type with its **Grading policy**
(**Full** or **Corrections only**), task count, first-shot rate (only for
**Full** rows), and steering turns per task.
### Backfill classification
Use **Backfill classification** to grade historical threads that were not
yet classified:
1. Select a date window.
2. Choose **Estimate** — Genesis counts candidate threads and returns an
estimated cost. The **Run backfill** button appears only after a fresh
estimate for the current window.
3. Choose **Run backfill** to start processing from that estimate.
Changing the date window discards any stale estimate so a run cannot start
against the wrong window. The **Runs** table below lists prior classification
and backfill jobs with mode, status, window, threads scanned, turns
classified, estimated cost, actual cost, and created time. Genesis polls
the table while a run is **running**.
In the **Runs** table, the actual-cost cell pairs each unpriced-call count
with a known-priced amount when available (otherwise marking the amount
unknown); see [Chat and Threads](/docs/User-Guide/Chat-And-Threads) for the
related thread summary.
## Agent Learning
Open **Pulse → Agent Learning** (`/pulse/agent-learning`) to review recurring
steering patterns surfaced by the agent-review pipeline, adopt or dismiss them,
and measure whether adopted learnings improved agent behavior. The page is the
Pulse companion to [Agent Scorecard](#agent-scorecard). It requires Pulse panel
access (`access_pulse_panel`) and is active only when agent review is enabled
for the deployment. When it is disabled, learning requests return `404` and the
page shows a disabled-state message with a link to **Config → Advanced Settings
→ Agent Review**. Other request failures show the normal load-failure message.
Use the header **Agent** selector to scope all three tabs to one bot or
**All agents**.
| Tab | Purpose |
| - | - |
| **Candidates** | Ranked queue of open, adopted, and dismissed learning candidates. |
| **Improvement report** | Before/after metrics for each adoption over a configurable horizon. |
| **Adoption history** | Chronological ledger of every recorded adoption. |
### Candidates queue
The **Candidates** tab is the default view. Use the status pills to filter
**Open** (default), **Adopted**, **Dismissed**, or **All**. Genesis preserves
the filter in the URL (`?status=`) so you can share or bookmark a view.
Candidates are ranked by the server — distinct users first, then occurrence
count, then most recently seen — and the UI renders them in that order. Each
card shows the pattern summary, workflow type, table anchor (or **Unanchored**
when no anchor could be resolved), occurrence count, distinct-user count, and
the first/last seen dates.
Candidate decision permissions and the disabled-control behavior are described
in the [RBAC practical guide](/docs/Security-Controls/RBAC-Practical-Guide).
Expand **Evidence** on a card to open the chat threads that triggered the
pattern. For **Open** candidates you can:
| Action | When it applies | Effect |
| - | - | - |
| **Accept** | The pattern has a table anchor | Sends the candidate text shown in the card through its Action Review item. After the item is approved and applied, writes a team-visible wiki learning at that anchor and marks the pattern adopted. |
| **Accept as summary** | The pattern is **Unanchored** | Sends the candidate text through its Action Review item, then records the adoption without writing a wiki learning (summary-only). The primary **Accept** control is disabled for unanchored patterns. |
| **Dismiss** | Any open candidate | Marks the pattern dismissed and removes it from the open queue. |
Genesis asks for confirmation before accept or dismiss. An accept is tied to the
candidate text rendered in the card: Genesis finds or creates that candidate's
Action Review item, and the authenticated person decides and applies it. A
candidate whose text changed after the card was loaded is not published; the
queue reports that it changed so you can read the updated candidate before
trying again. After the Action Review attempt settles, Genesis only adopts an
anchored learning whose matching text landed during that attempt; an older
matching learning is not reused. While an accept is running or its outcome is
unsettled, the row shows **Held**, disables both decisions, and may show the
hold end time. If an
accept may already have published the learning, the queue links to the holding
Action Review item and tells you whether to wait for reconciliation or retry
after the hold; do not submit a second accept from the stale row. If another
operator already resolved the candidate, Genesis shows a conflict message and
refreshes the list.
### Improvement report
The **Improvement report** tab compares task metrics before and after each
adoption. Use the **Horizon** pills to choose the server default window or
**7 days**, **14 days**, or **30 days** around the adoption date (`?horizon=`
in the URL).
Each adoption card shows the headline, source, agent, workflow type, anchor
(when present), adoption date, and the selected horizon. When enough graded
tasks exist in both windows, Genesis plots **Steering turns / task** (lower is
better) and **First-shot success** (higher is better) as before → after
dumbbell charts. When a metric is unavailable — for example because the
workflow uses a **corrections only** grading policy or the windows are too
thin — Genesis shows an explicit unavailable note instead of a number. When
overall task volume is below the minimum per window, the card shows **Not
enough data** with the before/after task counts.
Adoption sources appear as **Auto-supersession**, **Steering pattern**, or
**Manual**.
### Adoption history
The **Adoption history** tab lists every recorded adoption, newest first. The
**Adoption ledger** table includes adopted time, source, agent, workflow type,
anchor, learning link, and who created the adoption.
When a weakness has derived coaching status, its coaching status text links to
the matching adoption in this ledger. The link opens Agent Learning with the
agent selected and the history filtered to that adoption; use **Clear filter**
to return to the full ledger. If the server does not provide a matching
adoption id, the coaching status remains text without a link.
When a wiki learning was written and the adoption is anchored, **View learning**
opens the wiki page at that anchor. Summary-only adoptions (no wiki statement)
show a **Summary-only** badge. Adoptions with a statement but no resolvable
anchor page show **Learning (no anchor page)**.
## CWA Monitor / Slots summary
The **CWA Monitor / Slots** page loads the full slots payload from
`GET /api/admin/slots`, including per-thread user identity fields shown in the
acquired and waiting tables. In auth-enabled deployments you need
`access_config_panel`; without it the page cannot load slot details.
`GET /api/health/slots` returns the same operational counters and timing fields
but omits `user_id`, `user_display_name`, `thread_purpose`, and `thread_name`.
In auth-enabled deployments that route requires a signed-in session (anonymous
callers receive `401`). Tokenless load-balancer probes should use
`GET /api/health` or `GET /api/health/ready` instead.
The **CWA Monitor / Slots** summary separates actively running work from
temporary cooldown holds so capacity is easier to interpret at a glance.
| Metric | Meaning |
| - | - |
| **Active** | Slots currently executing work. |
| **In Cooldown** | Slots still held during the cooldown window after active work finishes. |
| **Occupied** | `Active + In Cooldown`, shown as `occupied / max slots` for total capacity usage. This is the main capacity indicator to watch. |
| **Waiting** | Threads queued for the next available slot. |
When a slot limit is configured, the **Occupied** summary highlights overall
usage: green below 70%, yellow at 70% or higher, and red when all slots are
occupied.
If a refresh of `GET /api/admin/slots` fails — for example during a network
interruption or while your session cannot reach the admin endpoint — the page
shows a red banner at the top. When Genesis can surface an underlying client
error detail (such as `Network Error`), the banner reads **Failed to refresh
slot data (Network Error) — retrying automatically** with that detail in place
of `Network Error`. When no detail is available, the banner reads **Failed to
refresh slot data — retrying automatically**. The page keeps its normal
auto-refresh cycle and clears the banner after a successful fetch.
## Live Logs filtering and drill-down
Use the Live Logs toolbar to move quickly between broad monitoring and
request-level troubleshooting.
| Control | Purpose |
| - | - |
| **Search** and **Regex** | Match message text and contextual fields from the current log stream. |
| **Filters** | Combine minimum level and time range with contextual filters for **Bot**, **Thread**, **Tool**, **Origin**, **Phase**, **Module**, **Request**, and **User** when those values are present. |
| **View toggles** | Live Logs opens in **Raw** view by default. You can switch between **Table** and **Raw**, change **Compact** versus **Verbose** formatting, hide or show harvester logs, and pause or resume live streaming. |
| **Copy Filtered** | Copy the currently filtered log entries to your clipboard. Genesis uses the current **Compact** or **Verbose** format for the copied text, ignores blank spacer rows, and disables the action when no log entries match the current view. |
| **More actions** | Open the actions menu for disk downloads and buffer maintenance. Requires config-panel access (`access_config_panel`). |
| **Entry details** | Select any row or line to open the detail panel, copy the message or JSON payload, and apply a quick filter from a context value. |
The **More actions** menu exposes disk-backed downloads that are not limited to the
in-memory Pulse buffer:
| Action | Purpose |
| - | - |
| **Download logs** | Stream the current application log file (`app.log` by default) as plain text. |
| **Download error logs** | Stream the current dedicated error log file (`errors.log` by default) as plain text. This file captures `ERROR`/`CRITICAL` records and any log line that carried an exception traceback. |
| **Download error logs (ZIP)** | Download a ZIP archive (`error_logs.zip`) containing the current error log plus any daily-rotated backups (`errors.log.YYYY-MM-DD`). Genesis names rotated files by date at midnight. |
| **Clear logs** | Clear the in-memory Pulse log buffer (does not delete on-disk log files). |
Genesis writes the dedicated error log to the path configured by
`GENESIS_ERROR_LOG_FILE` (default `logs/errors.log`). Set
`GENESIS_ERROR_LOG_FILE` to an empty string to disable error logging; download
actions then return a not-found response. Retention of rotated daily files is
controlled by `GENESIS_ERROR_LOG_BACKUP_COUNT` (default `1`).
In **Raw** view, Genesis opens at the newest log lines and keeps auto-following while you stay near the bottom. Press `Enter` while the Raw log viewer or page background has focus to insert a blank spacer row between log groups during live troubleshooting. Spacer rows stay visible in Raw view, remain selectable so you can drag through them when copying a log range, and do not affect level counts, displayed totals, or filter options. Long raw lines stay fully visible with horizontal scrolling instead of truncating the end of the entry.
If you are tracing a failing API or UI action, capture the `X-Request-Id`
response header and use the **Request** filter in Live Logs to isolate the
related entries.
## Jobs controls
The **Jobs** view groups operator-facing background work so you can pause or
resume the right layer without hunting through internal job ids. Toggle state
is persisted in runtime config, so jobs that you disable there stay disabled
across restarts.
In auth-enabled deployments, job switches and gateway status rows require
`access_config_panel`. Without that permission, job switches are disabled and
Pulse does not load the saved job settings or gateway status.
The optional jobs below are off by default. Enable them from **Pulse -> Jobs**;
the listed config paths are the persisted settings behind those controls.
| Job | Config path | Default |
| - | - | - |
| **Twin harvest (master)** | `jobs.twin_harvest.enabled` | `false` |
| **Harvester** | `jobs.harvester.enabled` | `false` |
| **Project todo** | `jobs.todo.enabled` | `false` |
| **dbt Cloud** | `jobs.dbt_cloud.enabled` | `false` |
| **Harvester watchdog** | `jobs.harvester.watchdog_enabled` | `false` |
| **Thread retention archival** | `archive.threads.enabled` | `false` |
| Section | What it controls |
| - | - |
| **Twin harvest** | Global `Twin harvest (master)` switch. When off, the daily `twin_daily_scan` prompt job is paused and per-connection `auto_twin_harvest` triggers are short-circuited. In-flight Twin scans still finish. |
| **Core background jobs** | Harvester, project todo, dbt Cloud, harvester watchdog, and sandbox monitor jobs. |
| **System jobs** | Orphan files cleanup, metrics bridge upload, apps TTL cleanup, apps runtime cleanup, dataset snapshot cleanup, coding-agent session cleanup, Slack runtime monitor, cost cube retention cleanup, and thread retention archival. |
| **Gateways** | Gateway services such as Naylence Fabric and the A2A server when those integrations are enabled. In a Databricks App, see [Agent Gateways](/docs/Setup/Agent-Gateways) for which gateway surfaces remain available. |
Pulse omits transient internal handles such as one-off download or refresh ids
from this view so the list stays operator-oriented.
The **sandbox monitor** job (`sandbox_monitor_job`) may report `stopped` when
Genesis has no active sandbox runtime sessions to watch. That is intentional
dormancy, not an operator pause. In `GET /api/scheduler/jobs` and other job
inventories, `status_reason` is set to values such as
`dormant:no_active_runtime_sessions` so automation and operators can tell
dormancy apart from a manual stop. The monitor resumes automatically when
sandbox activity returns.
Azure Container Instances sessions are included in sandbox timeout enforcement
by default. Set `jobs.sandbox_monitor.enforce_azure` to `false` to disable timeout
enforcement for Azure Container Instances; its type is `bool` and default is
`true`.
## Server thread observability
The **Server** view now breaks Python runtime threads into provenance-aware
families so long-lived pools, background workers, and unattributed threads are
easier to distinguish at a glance.
To inspect the full Python thread list and each thread's origin, open **Pulse →
Server** and select the information icon beside **Thread Diagnostics**. In
SPCS, open the displayed endpoint in the browser session you are signed in
with. In other deployments, run the displayed `curl` command with a Personal
Access Token; see [Personal Access Tokens](/docs/User-Guide/Personal-Access-Tokens)
for how to create and use one. The endpoint is `GET /api/health/threads`.
| Metric | Meaning |
| - | - |
| **Python Threads** | Total live Python threads in the current process. |
| **Tracked Threads** | Threads Genesis attributed to repo-owned code or registered thread pools. |
| **Untracked Threads** | Threads visible to Python that Genesis could not yet attribute. |
| **Oldest Tracked Age** | Age of the oldest tracked live thread. |
| **Top families** | Largest live thread families, shown with count and oldest live age when provenance metadata is available. |
| **Growing families** | Families whose live count increased since the previous server-telemetry snapshot, shown as delta versus current count. |
When provenance metadata is not available for a family yet, Pulse falls back to
the older prefix-based summary so the **Server** view still surfaces the busiest
thread groups.
The **Server** view also shows the async prompt dispatcher used for prompt
ingress. These counters help distinguish active work, queued newer prompts,
completed dispatches, and dispatch failures.
| Metric | Meaning |
| - | - |
| **Total workers** | Total per-thread async-dispatch workers currently tracked. |
| **Active workers** | Workers currently processing a prompt. |
| **Pending workers** | Workers with a newer prompt waiting for dispatch. |
| **Active tasks** | Async-dispatch tasks currently active. |
| **Dispatch completed** | Async-dispatch requests completed since initialization. |
| **Dispatch errors** | Async-dispatch requests that ended with an error since initialization. |
The same **Server** view also exposes a dedicated thread-service block so
worker startup, RPC health, route fallbacks, and thread search behavior are
visible without running a live probe manually.
| Metric group | Meaning |
| - | - |
| **Startup** | Last boot outcome, elapsed time, attempts, time to first RPC, and cumulative boot/failure counts for the worker process. Worker boot also seeds system-bot context-tool defaults and runs the one-shot legacy `AVAILABLE_TOOLS` → context-tools migration on SQLite/Snowflake metadata backends (best-effort; logged failures do not block the worker; preserves explicit Agents Center tool policy when already configured). |
| **RPC** | Total calls, errors, timeouts, average and recent latency, slow/very-slow call counts, the last slow action, and age since the last successful RPC. |
| **Reads / Writes** | Thread-service route counts plus any fallback-to-local signals that show work escaping the thread-service path. |
| **Search** | Search call volume, errors, timeouts, empty results, latency, last backend, and last match count. |
| **Loaded threads** | Approximate in-memory `BotOsThread` count plus the number of bot sessions currently holding loaded threads. |
When Genesis derives the **Server** tile health from thread-service RPC metrics, Genesis classifies individual RPC calls at or above 10 seconds as slow and at or above 30 seconds as very slow. Large-thread `run_compression` work can legitimately take many minutes, so Genesis isolates compression's contribution using per-action counters in `rpc_metrics.actions` (for example `run_compression.slow_calls` and `run_compression.very_slow_calls`) and evaluates slow/very-slow totals only for other RPCs such as reads, writes, and search. Slow or very-slow compression alone never pins the tile yellow or red; compression failures still surface when they increment RPC error or timeout totals. Because non-compression `slow_calls` is a cumulative since-boot counter, one to four slow calls after cold-cache reads or post-startup IPC backpressure do not by themselves elevate the tile to warning — Genesis waits for five or more slow non-compression calls before treating slow-call volume as sustained noise. Any non-compression very-slow call marks the tile critical. Other signals — errors, timeouts, route fallbacks, or an inactive worker — still surface as warning or critical on their own.
When the **Thread Service Process** badge is warning or critical, the Server view shows a **Why flagged** list with every condition contributing to the badge, ordered from most severe to least severe. The corresponding metric rows are marked so you can connect each reason to its counter. The list can identify an inactive worker, main-process reads or writes, very-slow RPCs, RPC errors or timeouts, route fallbacks, sustained slow RPCs, and search errors or timeouts. RPC failure reasons can include the action, outcome, age, and error message; search-error reasons can include the latest search error. These counters accumulate since the server process started, and the displayed window uses the process uptime when the metric snapshot does not provide its own uptime.
## Server restart access
The **Server** view includes a guarded **Restart** action for admins and for roles that include the `manage_scheduler` permission. In OAuth- or OIDC-protected deployments, Genesis sends the restart request through your current signed-in UI session so the required auth token is included automatically.
To prevent accidental restarts, you must type `RESTART` before confirming. Restarting terminates the current backend process, drops in-flight work, and disconnects active sessions. In orchestrated environments such as Kubernetes or SPCS, the container usually starts again automatically; unmanaged local processes may simply stop.
## When to use Pulse
Use Pulse when you need to answer questions like:
* Is Genesis healthy right now?
* Are background jobs running correctly?
* Are datasets or metrics uploads lagging?
* Are there recent operational errors or download issues?
## Related pages
* [Scheduler](/docs/User-Guide/Scheduler)
* [Metrics](/docs/Setup/Metrics)
* [Harvester Status](/docs/Setup/Harvester-Status)
## Main Pulse views
| View | Purpose |
| - | - |
| **Live Logs** | Stream and filter runtime logs. |
| **Jobs** | Review grouped background jobs, toggle them on or off, and pause Twin harvest globally. |
| **Downloads** | Inspect generated or downloaded assets. |
| **Server** | Check process, memory, health, and request metrics, and use the guarded restart action when your role allows it. |
| **CWA Monitor / Slots** | Review operational capacity and active workload slots where enabled. |
| **CLI Workspaces** | Monitor per-user CLI terminal workspaces and, with the required permission, restart or cancel one. |
| **Metrics Upload** | Verify bridge-upload cadence and destination settings. For Databricks restart durability and destination caveats, see [Durable SQLite stores](/docs/deployments/Databricks/Genesis-On-Databricks#durable-sqlite-stores). |
| **Metrics Dashboard** | Review higher-level usage and performance trends. |
| **Agent Scorecard** | Review agent-grading KPIs, trend charts, workflow breakdowns, and backfill classification runs. |
| **Agent Learning** | Review recurring steering-pattern candidates, accept or dismiss learnings, measure post-adoption improvement, and browse the adoption ledger. |
| **Mission Value** | Compare observed completed-mission time with manual duration baselines and review adoption ROI coverage. |
| **Costs** | Review this instance's spend, data quality, activity and execution drilldowns, retained call evidence, and spend controls. |
| **User Info** | Inspect current user-related operational info. |
| **Genesis Enhancements** | Review support and enhancement summaries plus dormant-review health. |
In OAuth- or OIDC-protected deployments, the **Live Logs**, health, **Server**,
and **CWA Monitor / Slots** views use your current signed-in UI session for
protected fetches and live streams. That includes health checks, recent-error
queries, log streaming, and the guarded restart action. The **Server** view and
its runtime telemetry (`GET /api/health/detailed`,
`GET /api/health/server-panel-telemetry`) require `access_config_panel` when
auth is enabled. The **CWA Monitor / Slots** view loads the full agent-slots
payload from `GET /api/admin/slots`, which also requires `access_config_panel`.
If a Pulse Server request returns `403` without an `X-Request-Id` response
header, Pulse identifies it as a proxy or firewall blocking the request before
it reaches Genesis, rather than a Genesis permission denial, and shows the API
path. A `403` with the header is reported as a Genesis permission denial and
includes the returned error detail when available.
The **Metrics Upload** card tracks scheduled bridge-mode uploads. Direct OTLP
metrics export is configured separately on [Metrics](/docs/Setup/Metrics) and
does not use the bridge upload queue. After two consecutive job-level upload
failures (each job attempt already retries three times), bridge uploads pause
for one hour. Each subsequent failed attempt doubles the pause, up to 24 hours;
uploads resume automatically after the backoff, and a successful upload clears
the failure streak.
For bot-attributed LLM usage and prompt-cache miss telemetry in exported
metrics, see [Metrics](/docs/Setup/Metrics).
## Costs
Open **Pulse → Costs** (`/pulse/costs`) to review the serving instance's spend
and what caused it. The page is available on every install to a signed-in user
with Pulse panel access. It shows "Recording since" the moment this install
began recording spend; a window that starts earlier shows "No data before" that
moment and is clamped to it. Until the cost data's indexes are built (the first
quiet window after an upgrade) the page says "Preparing cost data" and shows no
figures.
Pulse → Costs is the supported cost investigation page; the built-in Cost &
Usage Dash app is optional for older workflows. Metrics Dashboard continues to
show Messages, Users, and Tokens. A saved link to its former Cost tab opens
Pulse → Costs.
Choose a **24 hours**, **7 days**, **30 days** (the default), or **6 months** reporting
window. The summary includes spend-over-time and token-use charts, alongside
the statement that distinguishes known priced spend from unpriced usage,
reserved Context Graph tokens, incomplete attribution, and rows outside the
instance total. Known priced spend counts only calls with a catalog price. A call
at an estimated price (default rates because the model has no catalog price, or a
price whose source was not recorded) is reported on its own **Estimated price**
line, with its dollars and request count; it is
never added to the known priced total. Unpriced usage is a count, never $0. A
freshness panel identifies whether chat or Context Graph producers are current,
stale, preparing, failed, disabled, or unsupported. While cost data is being
prepared the page checks every 60 seconds, then refreshes the summary and spend
controls every 30 seconds while the page is visible. Activity and execution
drilldowns remain paused until figures are ready. An up-to-date Context Graph
rollup with no recorded usage says nothing has been recorded since the store's
recording cutover, or that nothing has been recorded yet when no cutover is
available; it does not report an unknown or stale state. When an activity
contains only tokens reserved against the Context Graph cap and no requests or
measured usage, its cost appears as **reserved only**, not `$0\`. If the install
has no configured name, Costs omits its generated fallback identifier from
empty-state and spend headlines.
The statement can open the **Written while cost accounting was off**,
**Arrived after their day was sealed**, and **Revised after their day was
sealed** lines to their ledger records. Showing those records requires
`access_config_panel`. The first two lines describe records outside the total;
the revised-after-seal line shows the latest revision while the total keeps the
value counted when the day was sealed. The gap ledger is not split by instance,
so its records can include other instances on a shared store. Records load a
page at a time. See the [Costs API
reference](/docs/Genesis-API/API-Reference#internal-cost-accounting-endpoints)
for the response fields and access requirement.
The **Breakdowns** section splits spend by source or activity group, model,
agent, provider, pricing quality, attribution quality, operation, origin, and
call type. Operation, origin, and call type use the summary's grouped figures;
their tables load separately from the other breakdowns. Select a breakdown row
to filter **Activity detail**; select another chart bucket or breakdown row to
change the detail, or clear the filters to return to the full window. Chart
bars show hourly or daily buckets depending on the selected range. Click a
bucket, or choose one from the bucket picker and select **Show activities**, to
scope Activity detail to that bucket. These selections are kept in the page URL
and remain in effect after a reload. Activity-based breakdowns can be partial
while more activity rows or model entries remain to be loaded.
Genesis AI model rows are labeled **Genesis AI** (or by their Genesis AI role)
instead of exposing the underlying model identifier. Their pricing source is
shown as **Genesis AI**, not as the upstream rate catalog used internally.
Expand an activity in **Activity detail** to see its executions inline, then
expand an execution to inspect retained **Calls**. Activity rows show known
priced spend, quality qualifiers, execution count, last-seen time, and whether
the activity is recurring. See the [Costs API reference](/docs/Genesis-API/API-Reference#internal-cost-accounting-endpoints)
for the `true`, `false`, and `null` meanings of the recurring indicator. Where
available, links open the scheduled job, Digital Twin source, or scheduler run
history. Unattributed spend can appear as separate chat and Context Graph
activity rows; expanding either row drills into only that producer's executions
and evidence. When a detail filter is active, the expanded activity lists the
cost records behind its filtered amount instead of runs; an execution count
may still include all runs of the activity rather than only runs within the
filtered spend. Without filters, an activity with no run started in the
selected window shows its cost records for that window, since there is no run
to expand. If the activity list and its records resolve the selected time
window at different moments, Costs warns that their windows differ and offers
**Re-read** to fetch them together.
Calls show compact call or hourly Context Graph evidence. Call details include
cache read/write token counts, and Context Graph bucket details include
reserved embedding tokens. A dash means a count was not recorded, not that it
was zero. Calls can be complete, partial, or expired; an expired execution
keeps its summary even after raw call evidence passes the retention boundary.
When you select a Context Graph source activity, the execution list also shows
that source's sweep status. This on-demand Twin read shows the effective
per-source limits (or that the source is unbounded), the latest recorded sweep
outcome and stop reason, exhausted budget units, and whether a halted sweep has
room under the current budget. When usage was recorded, the panel also shows
the sweep's total active time, objects, queries, and containers across its
cycles, with configured limits alongside the corresponding usage. It labels
totals for an in-progress or halted sweep as used so far; those sweeps may
continue. Before any outcome is recorded, the panel says the source has not
been scanned; if Twin cannot provide the status, it marks the source
unavailable. The source activity's known priced spend appears with the sweep
details. See the [Costs API reference](/docs/Genesis-API/API-Reference#internal-cost-accounting-endpoints)
for the response fields.
The **Spend controls** panel shows the Context Graph background token cap and
per-agent budgets. **Adjust cap** edits the same cap as the Digital Twin spend
page; a blank cap means unlimited background scanning, while `0` blocks all
background scanning. The page also links to the Digital Twin editor. If the
cost-accounting rollup job is enabled, its default interval is
`jobs.cost_accounting_rollup.interval_seconds=300` seconds, so newly written
facts can take up to the next rollup pass to appear in the totals. The initial
rollup wait is separate from this interval: the page checks for readiness every
60 seconds until the first rollup is ready, then refreshes the figures every
30 seconds while the page is visible.
## CLI Workspaces
Open **Pulse → CLI Workspaces** (`/pulse/cli-workspaces`) to monitor the running
workspaces created by the direct CLI terminal. The view is available when
`cli_terminal.enabled` is `true` (the default is `false`) and the signed-in user
has `view_sandboxes`. The list refreshes every 10 seconds and shows each
workspace's owner, status, age, CPU, and memory. When the Kubernetes metrics
server is unavailable, live resource usage is shown as unavailable while the
configured limits remain visible.
Users with `manage_sandboxes` can restart or cancel a workspace after confirming
the action. Restart deletes and recreates the workspace pod; cancel deletes the
pod. In both cases, the user's volume and saved sessions are kept, and a new
workspace is created on the next connection. The page also displays the
Genesis CLI connection command for the server being viewed.
## Mission Value
Open **Pulse → Mission Value** (`/pulse/mission-value`) to review the current
deployment instance's completed-mission volume and manual-versus-Genesis time.
The page requires `view_all_missions` and Pulse panel access. Choose a 30-,
90-, or 365-day reporting range, optionally filter by normalized work type, and
page through the mission drilldown. The report is read when the page loads or
its filters change; it is not a scheduled background refresh.
The page shows exact, estimated, and incomplete observations; candidate and
filter counts; work-type shares; cycle, lead, human-wait, and signed-savings
totals; and the percentage of observed missions covered by a manual baseline.
Signed saved work is manual baseline minus Genesis cycle for exact,
baseline-covered missions, so negative values remain visible. A mission's
quality details are available in the drilldown.
Configure manual baselines and their environment-override behavior in [Mission
Value settings](/docs/Setup/Advanced-Settings#mission-value-settings).
Work type is derived from `blueprint_name`, then `project_type` as a fallback;
renaming either value changes grouping and baseline matching. The current
baseline is applied retroactively to matching exact missions in the selected
range. For the HTTP contract, see [Mission Value endpoints](/docs/Genesis-API/API-Reference#mission-value-endpoints).
The **Live Logs** view subscribes to the live stream and then loads recent
history. Genesis queues any matching lines that arrive during that bootstrap
window and emits them once after the historical batch returns, which avoids
missing or duplicated lines as the stream connects.
Live entries now carry contextual attribution when Genesis can resolve it. In
practice that means you can filter or inspect logs by bot, thread, tool,
origin, phase, request, user, or module path instead of relying only on the
message text. Slack lifecycle, warning, and error events are also forwarded
into the same log stream, so Slack reconnect activity stays visible in Pulse.
## Genesis Enhancements summary
The **Genesis Enhancements** Pulse card now includes a compact dormant-review
summary alongside the ticket lifecycle counts. It shows the dormant-review
scheduler `status`, the current mode (`dry-run`, `drafts`, or `scan-only`),
queued review count, generated draft count, failure count, and the latest
reviewed-thread total from the most recent run.
Use the link in that card to jump back to **Config -> Support and
Enhancements** when you need to change `dry_run`, `create_drafts`, or the
saved scheduler settings. The card refreshes every 15 seconds, so it is a
quick operator view rather than the full configuration surface.
## Agent Scorecard
Open **Pulse → Agent Scorecard** (`/pulse/agent-scorecard`) to review how
agents are performing under the agent-review grading pipeline. The page
requires Pulse panel access (`access_pulse_panel`) and is active only when
agent review is enabled for the deployment. When it is disabled, scorecard
requests return `404` and the page shows a disabled-state message with a link
to **Config → Advanced Settings → Agent Review**. Other request failures show
the normal load-failure message.
Use the header controls to scope the view:
| Control | Purpose |
| - | - |
| **Agent** | Select which bot's classified threads to score. Genesis defaults to the first agent that has classified data. |
| **Workflow type** | Filter to one workflow type or **All workflow types**. |
| **Filters** (slider icon) | Set the date range (**Last 7 days**, **Last 30 days**, **Last 90 days**, or **Custom** with a date picker) and granularity (**Day** or **Week**). The default range is the last 30 days. |
When data exists for the selection, Genesis shows KPI cards, trend charts, a
workflow breakdown table, and a backfill panel.
### KPI cards
| KPI | Meaning |
| - | - |
| **First-shot success** | Share of tasks completed without steering corrections, weighted across **full**-policy rows only. Shows **—** with a note when the selection is graded under **corrections only** and first-shot is suppressed. |
| **Steering turns / task** | Average steering turns per classified task across all grading policies. |
| **Threads classified** | Sum of per-bucket thread counts across the selected window. |
| **Known priced spend** | Sum of chat-call costs priced from the catalog. Spend that Genesis recorded at an estimated price, such as a model priced at default rates because it has no catalog price, is not in this total: when estimated spend or requests are present, it is shown beneath the KPI as **Estimated price** with its request count, as on the Costs page. Calls without a price or with missing pricing details are excluded and listed beneath the KPI. When the selection has no catalog-priced calls, the amount is shown as unavailable rather than as `$0`. |
| **Feedback** | Counts of user **met** and **not met** thumbs from [chat expectation-met feedback](/docs/User-Guide/Chat-And-Threads#expectation-met-feedback). |
### Trend charts
Genesis plots time-bucketed series for first-shot success rate, steering
turns per task, known priced spend (USD), latency (p50 and p95), tool error
rate, and user feedback (**Met** / **Not met**). When the price split includes
estimated spend or requests, that spend is plotted as its own **Estimated
price** series beside known priced spend.
Unpriced or unknown-price calls do not contribute to spend. If no calls have a known price, the chart
explains that there are no priced calls; if a bucket has no model-call records
or its cost data is unavailable, the chart says cost is unavailable.
First-shot charts show a suppression message instead of a line when every
bucket in the selection is **corrections only**.
### Workflow-type breakdown
The breakdown table lists each workflow type with its **Grading policy**
(**Full** or **Corrections only**), task count, first-shot rate (only for
**Full** rows), and steering turns per task.
### Backfill classification
Use **Backfill classification** to grade historical threads that were not
yet classified:
1. Select a date window.
2. Choose **Estimate** — Genesis counts candidate threads and returns an
estimated cost. The **Run backfill** button appears only after a fresh
estimate for the current window.
3. Choose **Run backfill** to start processing from that estimate.
Changing the date window discards any stale estimate so a run cannot start
against the wrong window. The **Runs** table below lists prior classification
and backfill jobs with mode, status, window, threads scanned, turns
classified, estimated cost, actual cost, and created time. Genesis polls
the table while a run is **running**.
In the **Runs** table, the actual-cost cell pairs each unpriced-call count
with a known-priced amount when available (otherwise marking the amount
unknown); see [Chat and Threads](/docs/User-Guide/Chat-And-Threads) for the
related thread summary.
## Agent Learning
Open **Pulse → Agent Learning** (`/pulse/agent-learning`) to review recurring
steering patterns surfaced by the agent-review pipeline, adopt or dismiss them,
and measure whether adopted learnings improved agent behavior. The page is the
Pulse companion to [Agent Scorecard](#agent-scorecard). It requires Pulse panel
access (`access_pulse_panel`) and is active only when agent review is enabled
for the deployment. When it is disabled, learning requests return `404` and the
page shows a disabled-state message with a link to **Config → Advanced Settings
→ Agent Review**. Other request failures show the normal load-failure message.
Use the header **Agent** selector to scope all three tabs to one bot or
**All agents**.
| Tab | Purpose |
| - | - |
| **Candidates** | Ranked queue of open, adopted, and dismissed learning candidates. |
| **Improvement report** | Before/after metrics for each adoption over a configurable horizon. |
| **Adoption history** | Chronological ledger of every recorded adoption. |
### Candidates queue
The **Candidates** tab is the default view. Use the status pills to filter
**Open** (default), **Adopted**, **Dismissed**, or **All**. Genesis preserves
the filter in the URL (`?status=`) so you can share or bookmark a view.
Candidates are ranked by the server — distinct users first, then occurrence
count, then most recently seen — and the UI renders them in that order. Each
card shows the pattern summary, workflow type, table anchor (or **Unanchored**
when no anchor could be resolved), occurrence count, distinct-user count, and
the first/last seen dates.
Candidate decision permissions and the disabled-control behavior are described
in the [RBAC practical guide](/docs/Security-Controls/RBAC-Practical-Guide).
Expand **Evidence** on a card to open the chat threads that triggered the
pattern. For **Open** candidates you can:
| Action | When it applies | Effect |
| - | - | - |
| **Accept** | The pattern has a table anchor | Sends the candidate text shown in the card through its Action Review item. After the item is approved and applied, writes a team-visible wiki learning at that anchor and marks the pattern adopted. |
| **Accept as summary** | The pattern is **Unanchored** | Sends the candidate text through its Action Review item, then records the adoption without writing a wiki learning (summary-only). The primary **Accept** control is disabled for unanchored patterns. |
| **Dismiss** | Any open candidate | Marks the pattern dismissed and removes it from the open queue. |
Genesis asks for confirmation before accept or dismiss. An accept is tied to the
candidate text rendered in the card: Genesis finds or creates that candidate's
Action Review item, and the authenticated person decides and applies it. A
candidate whose text changed after the card was loaded is not published; the
queue reports that it changed so you can read the updated candidate before
trying again. After the Action Review attempt settles, Genesis only adopts an
anchored learning whose matching text landed during that attempt; an older
matching learning is not reused. While an accept is running or its outcome is
unsettled, the row shows **Held**, disables both decisions, and may show the
hold end time. If an
accept may already have published the learning, the queue links to the holding
Action Review item and tells you whether to wait for reconciliation or retry
after the hold; do not submit a second accept from the stale row. If another
operator already resolved the candidate, Genesis shows a conflict message and
refreshes the list.
### Improvement report
The **Improvement report** tab compares task metrics before and after each
adoption. Use the **Horizon** pills to choose the server default window or
**7 days**, **14 days**, or **30 days** around the adoption date (`?horizon=`
in the URL).
Each adoption card shows the headline, source, agent, workflow type, anchor
(when present), adoption date, and the selected horizon. When enough graded
tasks exist in both windows, Genesis plots **Steering turns / task** (lower is
better) and **First-shot success** (higher is better) as before → after
dumbbell charts. When a metric is unavailable — for example because the
workflow uses a **corrections only** grading policy or the windows are too
thin — Genesis shows an explicit unavailable note instead of a number. When
overall task volume is below the minimum per window, the card shows **Not
enough data** with the before/after task counts.
Adoption sources appear as **Auto-supersession**, **Steering pattern**, or
**Manual**.
### Adoption history
The **Adoption history** tab lists every recorded adoption, newest first. The
**Adoption ledger** table includes adopted time, source, agent, workflow type,
anchor, learning link, and who created the adoption.
When a weakness has derived coaching status, its coaching status text links to
the matching adoption in this ledger. The link opens Agent Learning with the
agent selected and the history filtered to that adoption; use **Clear filter**
to return to the full ledger. If the server does not provide a matching
adoption id, the coaching status remains text without a link.
When a wiki learning was written and the adoption is anchored, **View learning**
opens the wiki page at that anchor. Summary-only adoptions (no wiki statement)
show a **Summary-only** badge. Adoptions with a statement but no resolvable
anchor page show **Learning (no anchor page)**.
## CWA Monitor / Slots summary
The **CWA Monitor / Slots** page loads the full slots payload from
`GET /api/admin/slots`, including per-thread user identity fields shown in the
acquired and waiting tables. In auth-enabled deployments you need
`access_config_panel`; without it the page cannot load slot details.
`GET /api/health/slots` returns the same operational counters and timing fields
but omits `user_id`, `user_display_name`, `thread_purpose`, and `thread_name`.
In auth-enabled deployments that route requires a signed-in session (anonymous
callers receive `401`). Tokenless load-balancer probes should use
`GET /api/health` or `GET /api/health/ready` instead.
The **CWA Monitor / Slots** summary separates actively running work from
temporary cooldown holds so capacity is easier to interpret at a glance.
| Metric | Meaning |
| - | - |
| **Active** | Slots currently executing work. |
| **In Cooldown** | Slots still held during the cooldown window after active work finishes. |
| **Occupied** | `Active + In Cooldown`, shown as `occupied / max slots` for total capacity usage. This is the main capacity indicator to watch. |
| **Waiting** | Threads queued for the next available slot. |
When a slot limit is configured, the **Occupied** summary highlights overall
usage: green below 70%, yellow at 70% or higher, and red when all slots are
occupied.
If a refresh of `GET /api/admin/slots` fails — for example during a network
interruption or while your session cannot reach the admin endpoint — the page
shows a red banner at the top. When Genesis can surface an underlying client
error detail (such as `Network Error`), the banner reads **Failed to refresh
slot data (Network Error) — retrying automatically** with that detail in place
of `Network Error`. When no detail is available, the banner reads **Failed to
refresh slot data — retrying automatically**. The page keeps its normal
auto-refresh cycle and clears the banner after a successful fetch.
## Live Logs filtering and drill-down
Use the Live Logs toolbar to move quickly between broad monitoring and
request-level troubleshooting.
| Control | Purpose |
| - | - |
| **Search** and **Regex** | Match message text and contextual fields from the current log stream. |
| **Filters** | Combine minimum level and time range with contextual filters for **Bot**, **Thread**, **Tool**, **Origin**, **Phase**, **Module**, **Request**, and **User** when those values are present. |
| **View toggles** | Live Logs opens in **Raw** view by default. You can switch between **Table** and **Raw**, change **Compact** versus **Verbose** formatting, hide or show harvester logs, and pause or resume live streaming. |
| **Copy Filtered** | Copy the currently filtered log entries to your clipboard. Genesis uses the current **Compact** or **Verbose** format for the copied text, ignores blank spacer rows, and disables the action when no log entries match the current view. |
| **More actions** | Open the actions menu for disk downloads and buffer maintenance. Requires config-panel access (`access_config_panel`). |
| **Entry details** | Select any row or line to open the detail panel, copy the message or JSON payload, and apply a quick filter from a context value. |
The **More actions** menu exposes disk-backed downloads that are not limited to the
in-memory Pulse buffer:
| Action | Purpose |
| - | - |
| **Download logs** | Stream the current application log file (`app.log` by default) as plain text. |
| **Download error logs** | Stream the current dedicated error log file (`errors.log` by default) as plain text. This file captures `ERROR`/`CRITICAL` records and any log line that carried an exception traceback. |
| **Download error logs (ZIP)** | Download a ZIP archive (`error_logs.zip`) containing the current error log plus any daily-rotated backups (`errors.log.YYYY-MM-DD`). Genesis names rotated files by date at midnight. |
| **Clear logs** | Clear the in-memory Pulse log buffer (does not delete on-disk log files). |
Genesis writes the dedicated error log to the path configured by
`GENESIS_ERROR_LOG_FILE` (default `logs/errors.log`). Set
`GENESIS_ERROR_LOG_FILE` to an empty string to disable error logging; download
actions then return a not-found response. Retention of rotated daily files is
controlled by `GENESIS_ERROR_LOG_BACKUP_COUNT` (default `1`).
In **Raw** view, Genesis opens at the newest log lines and keeps auto-following while you stay near the bottom. Press `Enter` while the Raw log viewer or page background has focus to insert a blank spacer row between log groups during live troubleshooting. Spacer rows stay visible in Raw view, remain selectable so you can drag through them when copying a log range, and do not affect level counts, displayed totals, or filter options. Long raw lines stay fully visible with horizontal scrolling instead of truncating the end of the entry.
If you are tracing a failing API or UI action, capture the `X-Request-Id`
response header and use the **Request** filter in Live Logs to isolate the
related entries.
## Jobs controls
The **Jobs** view groups operator-facing background work so you can pause or
resume the right layer without hunting through internal job ids. Toggle state
is persisted in runtime config, so jobs that you disable there stay disabled
across restarts.
In auth-enabled deployments, job switches and gateway status rows require
`access_config_panel`. Without that permission, job switches are disabled and
Pulse does not load the saved job settings or gateway status.
The optional jobs below are off by default. Enable them from **Pulse -> Jobs**;
the listed config paths are the persisted settings behind those controls.
| Job | Config path | Default |
| - | - | - |
| **Twin harvest (master)** | `jobs.twin_harvest.enabled` | `false` |
| **Harvester** | `jobs.harvester.enabled` | `false` |
| **Project todo** | `jobs.todo.enabled` | `false` |
| **dbt Cloud** | `jobs.dbt_cloud.enabled` | `false` |
| **Harvester watchdog** | `jobs.harvester.watchdog_enabled` | `false` |
| **Thread retention archival** | `archive.threads.enabled` | `false` |
| Section | What it controls |
| - | - |
| **Twin harvest** | Global `Twin harvest (master)` switch. When off, the daily `twin_daily_scan` prompt job is paused and per-connection `auto_twin_harvest` triggers are short-circuited. In-flight Twin scans still finish. |
| **Core background jobs** | Harvester, project todo, dbt Cloud, harvester watchdog, and sandbox monitor jobs. |
| **System jobs** | Orphan files cleanup, metrics bridge upload, apps TTL cleanup, apps runtime cleanup, dataset snapshot cleanup, coding-agent session cleanup, Slack runtime monitor, cost cube retention cleanup, and thread retention archival. |
| **Gateways** | Gateway services such as Naylence Fabric and the A2A server when those integrations are enabled. In a Databricks App, see [Agent Gateways](/docs/Setup/Agent-Gateways) for which gateway surfaces remain available. |
Pulse omits transient internal handles such as one-off download or refresh ids
from this view so the list stays operator-oriented.
The **sandbox monitor** job (`sandbox_monitor_job`) may report `stopped` when
Genesis has no active sandbox runtime sessions to watch. That is intentional
dormancy, not an operator pause. In `GET /api/scheduler/jobs` and other job
inventories, `status_reason` is set to values such as
`dormant:no_active_runtime_sessions` so automation and operators can tell
dormancy apart from a manual stop. The monitor resumes automatically when
sandbox activity returns.
Azure Container Instances sessions are included in sandbox timeout enforcement
by default. Set `jobs.sandbox_monitor.enforce_azure` to `false` to disable timeout
enforcement for Azure Container Instances; its type is `bool` and default is
`true`.
## Server thread observability
The **Server** view now breaks Python runtime threads into provenance-aware
families so long-lived pools, background workers, and unattributed threads are
easier to distinguish at a glance.
To inspect the full Python thread list and each thread's origin, open **Pulse →
Server** and select the information icon beside **Thread Diagnostics**. In
SPCS, open the displayed endpoint in the browser session you are signed in
with. In other deployments, run the displayed `curl` command with a Personal
Access Token; see [Personal Access Tokens](/docs/User-Guide/Personal-Access-Tokens)
for how to create and use one. The endpoint is `GET /api/health/threads`.
| Metric | Meaning |
| - | - |
| **Python Threads** | Total live Python threads in the current process. |
| **Tracked Threads** | Threads Genesis attributed to repo-owned code or registered thread pools. |
| **Untracked Threads** | Threads visible to Python that Genesis could not yet attribute. |
| **Oldest Tracked Age** | Age of the oldest tracked live thread. |
| **Top families** | Largest live thread families, shown with count and oldest live age when provenance metadata is available. |
| **Growing families** | Families whose live count increased since the previous server-telemetry snapshot, shown as delta versus current count. |
When provenance metadata is not available for a family yet, Pulse falls back to
the older prefix-based summary so the **Server** view still surfaces the busiest
thread groups.
The **Server** view also shows the async prompt dispatcher used for prompt
ingress. These counters help distinguish active work, queued newer prompts,
completed dispatches, and dispatch failures.
| Metric | Meaning |
| - | - |
| **Total workers** | Total per-thread async-dispatch workers currently tracked. |
| **Active workers** | Workers currently processing a prompt. |
| **Pending workers** | Workers with a newer prompt waiting for dispatch. |
| **Active tasks** | Async-dispatch tasks currently active. |
| **Dispatch completed** | Async-dispatch requests completed since initialization. |
| **Dispatch errors** | Async-dispatch requests that ended with an error since initialization. |
The same **Server** view also exposes a dedicated thread-service block so
worker startup, RPC health, route fallbacks, and thread search behavior are
visible without running a live probe manually.
| Metric group | Meaning |
| - | - |
| **Startup** | Last boot outcome, elapsed time, attempts, time to first RPC, and cumulative boot/failure counts for the worker process. Worker boot also seeds system-bot context-tool defaults and runs the one-shot legacy `AVAILABLE_TOOLS` → context-tools migration on SQLite/Snowflake metadata backends (best-effort; logged failures do not block the worker; preserves explicit Agents Center tool policy when already configured). |
| **RPC** | Total calls, errors, timeouts, average and recent latency, slow/very-slow call counts, the last slow action, and age since the last successful RPC. |
| **Reads / Writes** | Thread-service route counts plus any fallback-to-local signals that show work escaping the thread-service path. |
| **Search** | Search call volume, errors, timeouts, empty results, latency, last backend, and last match count. |
| **Loaded threads** | Approximate in-memory `BotOsThread` count plus the number of bot sessions currently holding loaded threads. |
When Genesis derives the **Server** tile health from thread-service RPC metrics, Genesis classifies individual RPC calls at or above 10 seconds as slow and at or above 30 seconds as very slow. Large-thread `run_compression` work can legitimately take many minutes, so Genesis isolates compression's contribution using per-action counters in `rpc_metrics.actions` (for example `run_compression.slow_calls` and `run_compression.very_slow_calls`) and evaluates slow/very-slow totals only for other RPCs such as reads, writes, and search. Slow or very-slow compression alone never pins the tile yellow or red; compression failures still surface when they increment RPC error or timeout totals. Because non-compression `slow_calls` is a cumulative since-boot counter, one to four slow calls after cold-cache reads or post-startup IPC backpressure do not by themselves elevate the tile to warning — Genesis waits for five or more slow non-compression calls before treating slow-call volume as sustained noise. Any non-compression very-slow call marks the tile critical. Other signals — errors, timeouts, route fallbacks, or an inactive worker — still surface as warning or critical on their own.
When the **Thread Service Process** badge is warning or critical, the Server view shows a **Why flagged** list with every condition contributing to the badge, ordered from most severe to least severe. The corresponding metric rows are marked so you can connect each reason to its counter. The list can identify an inactive worker, main-process reads or writes, very-slow RPCs, RPC errors or timeouts, route fallbacks, sustained slow RPCs, and search errors or timeouts. RPC failure reasons can include the action, outcome, age, and error message; search-error reasons can include the latest search error. These counters accumulate since the server process started, and the displayed window uses the process uptime when the metric snapshot does not provide its own uptime.
## Server restart access
The **Server** view includes a guarded **Restart** action for admins and for roles that include the `manage_scheduler` permission. In OAuth- or OIDC-protected deployments, Genesis sends the restart request through your current signed-in UI session so the required auth token is included automatically.
To prevent accidental restarts, you must type `RESTART` before confirming. Restarting terminates the current backend process, drops in-flight work, and disconnects active sessions. In orchestrated environments such as Kubernetes or SPCS, the container usually starts again automatically; unmanaged local processes may simply stop.
## When to use Pulse
Use Pulse when you need to answer questions like:
* Is Genesis healthy right now?
* Are background jobs running correctly?
* Are datasets or metrics uploads lagging?
* Are there recent operational errors or download issues?
## Related pages
* [Scheduler](/docs/User-Guide/Scheduler)
* [Metrics](/docs/Setup/Metrics)
* [Harvester Status](/docs/Setup/Harvester-Status)