> ## Documentation Index
> Fetch the complete documentation index at: https://docs.genesiscomputing.com/llms.txt
> Use this file to discover all available pages before exploring further.
# Metrics
> Configure metrics collection, export behavior, and reporting settings for your Genesis deployment.
## Overview
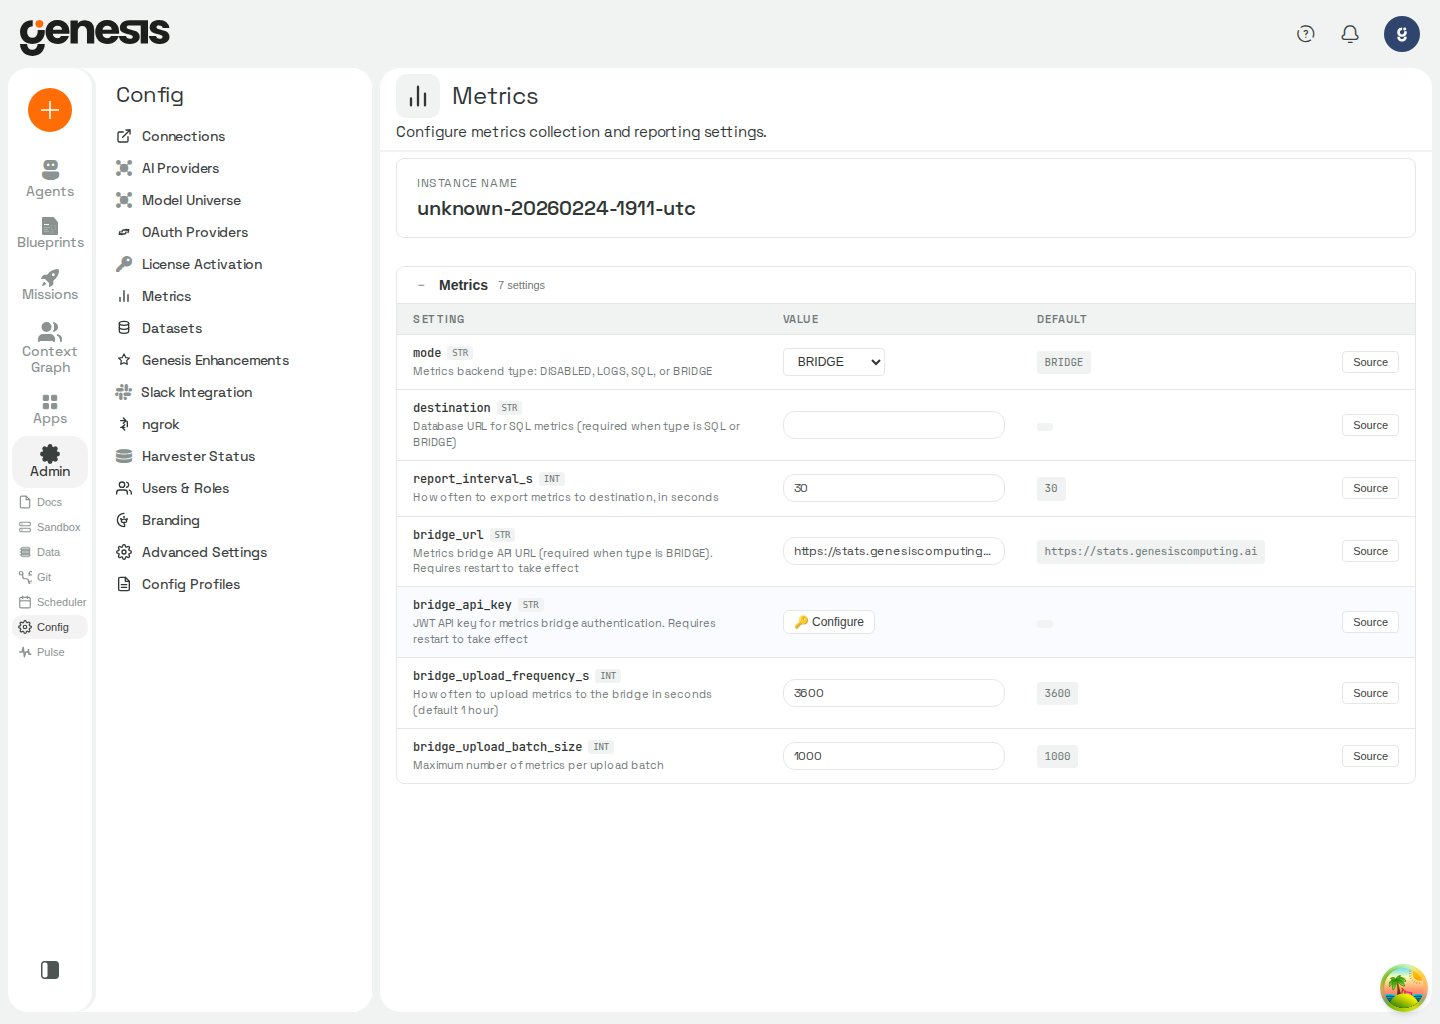
The **Metrics** page is the customer-facing configuration surface for metrics collection and reporting behavior.
 ## What customers configure here
* the metrics mode,
* destination or bridge settings,
* reporting interval,
* upload frequency,
* related metrics credentials or configuration values.
## Environment-specific behavior
Some deployments show additional instructions or approval actions when external metrics delivery requires extra configuration.
In Snowflake / SPCS bridge-mode deployments, the page can show
**Approve External Access** and **Assign to Genesis** controls for outbound
metrics delivery. After you trigger those actions, Genesis rechecks the
assignment immediately and updates the section in place as soon as the external
access integration is confirmed.
## OTLP export
Genesis can export metrics directly to any OpenTelemetry-compatible
collector — Prometheus, Datadog, Grafana Cloud, New Relic, Honeycomb,
Splunk Observability, OpenObserve, and so on — over the standard
OTLP/gRPC or OTLP/HTTP transports. This path is configured separately
from `metrics.mode`, so you can run OTLP on its own or alongside the
existing logs, SQL, or bridge pipeline.
### Configuration
| Setting | Type | Default | Description |
| - | - | - | - |
| `observability.metrics.enabled` | boolean | `false` | Enable direct OTLP metrics export. |
| `observability.metrics.protocol` | string | `grpc` | OTLP transport: `grpc` (default port 4317) or `http` (default port 4318, `/v1/metrics` path). Invalid values disable OTLP export. |
| `observability.metrics.endpoint` | string | `OTEL_EXPORTER_OTLP_ENDPOINT`, then `observability.tracing.endpoint`, then `http://localhost:4317` | OTLP endpoint URL. When set, this overrides the shared OTLP and tracing fallbacks. |
| `observability.metrics.headers` | string | empty | Optional comma-separated `key=value` header list passed to the exporter. Secret-backed values are resolved before export. See [Headers and authentication](#headers-and-authentication) below for the encoding rules. |
| `observability.metrics.export_interval_s` | integer | `30` | OTLP export interval in seconds. Invalid or non-positive values fall back to `30`. |
For `grpc`, Genesis performs a short startup availability check against
the configured endpoint before enabling OTLP export. If the collector is
unreachable, OTLP export is disabled cleanly and Genesis continues
running. Set `OTEL_METRICS_FORCE_ENABLE=true` only when you need to skip
that preflight (for example, when the collector starts after Genesis).
**Restart required.** All `observability.metrics.*` settings are read
once at startup. After changing any of them — including enabling OTLP
for the first time, swapping the endpoint, or rotating an auth header —
restart Genesis for the change to take effect.
### Headers and authentication
`observability.metrics.headers` follows the W3C OTLP header convention:
a comma-separated list of `key=value` pairs. The exporter
URL-decodes each value before sending, so any character that is awkward
to store in a flat config field (spaces, commas, `=`, etc.) must be
percent-encoded.
The single most common gotcha is the **space inside `Bearer ` tokens**:
the Genesis Secrets UI strips literal spaces from values to prevent
accidental copy-paste damage, so you must enter the space as `%20`.
| You want to send | Enter in `observability.metrics.headers` |
| - | - |
| `Authorization: Bearer eyJhbGciOi…` | `authorization=Bearer%20eyJhbGciOi…` |
| `X-API-Key: my-secret-key` | `x-api-key=my-secret-key` |
| Two headers at once | `authorization=Bearer%20,x-tenant-id=acme` |
| A value containing a comma | percent-encode the comma as `%2C` |
You can also store the entire header string in the **Secrets** panel
and reference it from `observability.metrics.headers` — the exporter
resolves secret-backed values before parsing.
### What gets exported
Every data point Genesis exports carries a global `instance` attribute
identifying the Genesis instance (set via `server.instance_name` or
`GENESIS__SERVER__INSTANCE_NAME`). The OpenTelemetry instrumentation
scope name is `genesis.metrics`. Counters are exported with **delta**
temporality (each export carries the increments since the previous
export, not a cumulative total). Gauges are sampled at export time.
Hosted Try Me instances also add a `tryme_instance` attribute to every
metric row, set to the instance's Fly app name. This is present when demo
mode and `demo.provisioner_url` are configured and `FLY_APP_NAME` is set;
it is omitted from laptop mode and other installations.
#### Gauges (point-in-time values)
| Metric | Unit | Attributes | What it measures |
| - | - | - | - |
| `ACQUIRED_SLOTS` | count | `instance`, `purpose` | Number of agent execution slots currently in use. Reported twice per tick: once with `purpose="*"` for the total, once with `purpose=""` for the per-purpose breakdown. |
| `FREE_SLOTS` | count | `instance`, `purpose="*"` | Number of agent execution slots still available (`max_slots − ACQUIRED_SLOTS`). |
| `WAITING_THREADS` | count | `instance`, `purpose` | Number of threads parked in the waiter queue because no slot was available. Reported twice per tick: total and per-purpose. |
`purpose` values: `user_chat` (interactive chat), `scheduled_job`
(scheduler-driven), `blueprint` (blueprint execution), `handoff`
(delegated work), `unknown`, or `*` (total across all purposes).
#### Counters (delta-exported)
| Metric | Unit | Attributes | What it measures |
| - | - | - | - |
| `MESSAGES_SENT` | count | `instance`, `bot_id`, `user_id` (hashed), `source` | User-initiated messages handed to a bot. `source` is `websocket` for interactive chat or `blueprint_start` for blueprint kickoffs. |
| `USER_ACTIVE` | count | `instance`, `tryme_instance` (hosted Try Me only), `user_id` (hashed), `auth_provider` | Activity tick when a person's last-login time is written on a hosted Try Me instance. Writes are throttled, so the count approximates active minutes rather than exact session duration. |
| `TOOL_CALLS` | count | `instance`, `tool_name`, `bot_id` | Tool invocations executed by the bot. `tool_name` is the canonical tool function name (e.g. `manage_context`, `search_threads`, `git_action`); `"unknown"` if it could not be resolved. |
| `LLM_CALLS` | count | `instance`, `model`, `provider`, `bot_id`, optional `execution_origin`, optional `credential_type` | LLM completion calls made by Genesis. |
| `LLM_PROMPT_TOKENS` | tokens | same as `LLM_CALLS` | Sum of input/prompt tokens consumed across LLM calls. The value includes cache-read tokens for all providers, including Snowflake Cortex. |
| `LLM_COMPLETION_TOKENS` | tokens | same as `LLM_CALLS` | Sum of output/completion tokens emitted by the model. |
| `LLM_CACHE_READ_TOKENS` | tokens | same as `LLM_CALLS` | Prompt-caching read tokens (cache hits — tokens billed at the discounted cache-read rate). Zero on providers without prompt caching. |
| `LLM_CACHE_CREATION_TOKENS` | tokens | same as `LLM_CALLS` | Prompt-caching write tokens (new cache entries). Zero on providers without prompt caching. |
| `LLM_CACHE_MISS_TOKENS` | tokens | same as `LLM_CALLS` | Prompt tokens in calls where the provider explicitly reports zero cache-read tokens. Missing or null cache-read values are not counted as misses. |
LLM counter attribute values:
* `model` — literal model string the request was sent with
(e.g. `gpt-5`, `claude-sonnet-4-6`, `cortex-claude-sonnet-4-6`);
`"unknown"` if the response did not include it.
* `provider` — `openai`, `anthropic`, `cortex`, `litellm_proxy`, etc.;
`"unknown"` if not reported.
* `bot_id` — agent identifier associated with the LLM call. Use this dimension
to attribute LLM usage and cache misses to a bot. Thread identifiers are not
exported as dimensions; per-thread cost remains in the thread's own
`thread_stats_v1` aggregate.
* `execution_origin` (only present for proxied / classified calls) —
for example `interactive_user`, `scheduled_background`,
`handoff_initiated`, `blueprint_runtime`. Lets you separate
human-driven cost from background-automation cost.
* `credential_type` (only present for proxied calls) — for example
`api_key`, `service_account`, `oauth_user`.
### Privacy
* **`user_id` is irreversibly hashed** before being attached to any
metric. Genesis generates a per-deployment salt the first time it
starts; your collector receives an opaque 32-character hex token, not
the raw user identifier. The salt never leaves the host.
* **No prompt content, completion content, or tool arguments** are
exported as metric attributes. Only metric values, counter increments,
and the attribute fields listed in the tables above.
* The `tool_name` and `bot_id` attributes are emitted as-is and may
appear in your collector. If you treat bot or tool names as
sensitive, scope your collector's data retention accordingly.
### Verifying it works
After enabling OTLP and restarting Genesis, look in the server logs at
startup for one of these messages:
| Log line | Meaning |
| - | - |
| `OTLP metrics export enabled: protocol= endpoint= interval=ms` | OTLP export is on. Data points should begin arriving at your collector within one export interval (default 30 s). |
| `OTLP metrics endpoint is not available; metrics OTLP export disabled` | The startup availability check failed. The endpoint is wrong, the collector is down, or the network path is blocked. Local SQL / bridge metrics continue working; only OTLP export is off until the next restart. |
| `OTLP metrics enabled but no endpoint configured; export disabled` | `observability.metrics.enabled=true` but no endpoint resolved. Set `observability.metrics.endpoint` (or one of the documented fallbacks). |
| `Invalid observability.metrics.protocol ''…` | `observability.metrics.protocol` is something other than `grpc` or `http`. |
When endpoints are logged, Genesis automatically strips credentials
(`user:pass@`) and query tokens from the URL before logging, so it is
safe to share these log lines for troubleshooting.
### Thread health probe log lines
Genesis emits single-line `THREAD_HEALTH_PROBE` records in server logs to
correlate slow threads without enabling debug tracing. Search logs for that
prefix, then filter by `phase=`:
| `phase` | When emitted | Typical use |
| - | - | - |
| `prep_start` | Before the model call, after prompt assembly | Pre-LLM prep drift, cache misses, large payload assembly |
| `llm_end` | After a model call completes | End-to-end LLM latency and token usage for one turn |
| `compression` | After a compression pass | Context saturation, no-op compressions, summary fallback usage |
| `adjacency_repair` | When orphan tool rows are dropped or synthesized | Repeated tool/adjacency repair on a thread |
| `ws_sender_slow` | When resolving the latest message sender for WebSocket delivery exceeds the hot-path threshold | Activity-path slowness under load |
Each line uses stable `key=value` segments (for example `thread_id`, `bot_id`,
`compression_event_count`, `dur_ms`). Values with spaces are JSON-escaped.
Thread message reads also emit `THREAD_MESSAGES_FETCH` records. The `import_ms`
field reports the worker's import duration in milliseconds to one decimal place;
it is `-` when that timing is unavailable or invalid. The record also includes
snapshot, formatting, RPC, and total-duration timings when available.
### Suggested first dashboards
| Dashboard panel | Metric(s) | Group by |
| - | - | - |
| Concurrent agent utilization | `ACQUIRED_SLOTS{purpose="*"} / (ACQUIRED_SLOTS{purpose="*"} + FREE_SLOTS{purpose="*"})` | `instance` |
| Capacity saturation | `WAITING_THREADS{purpose="*"}` | `instance` |
| Workload mix | `ACQUIRED_SLOTS{purpose!="*"}` | `instance`, `purpose` |
| Per-bot message volume | `rate(MESSAGES_SENT[5m])` | `instance`, `bot_id` |
| Daily active users (anonymized) | `count_distinct(user_id)` on `MESSAGES_SENT` over 24h | `instance` |
| Daily active Try Me users (anonymized) | `count_distinct(user_id)` on `USER_ACTIVE` over 24h | `tryme_instance` |
| Top tools by call rate | `rate(TOOL_CALLS[5m])` | `tool_name` |
| LLM spend by bot | `rate(LLM_PROMPT_TOKENS + LLM_COMPLETION_TOKENS)` × per-model unit price | `bot_id`, `model`, `provider` |
| Prompt-cache savings | `LLM_CACHE_READ_TOKENS / LLM_PROMPT_TOKENS` | `model` |
| Prompt-cache miss rate by volume | `LLM_CACHE_MISS_TOKENS / LLM_PROMPT_TOKENS` | `bot_id`, `model`, `provider` |
| Interactive vs background cost | `LLM_PROMPT_TOKENS + LLM_COMPLETION_TOKENS` | `execution_origin` |
## Metrics-mode combinations
When OTLP export is enabled, Genesis combines it with the selected
`metrics.mode` instead of replacing that mode:
* `DISABLED`: OTLP only
* `LOGS`: logs plus OTLP
* `SQL`: logging plus SQL storage, and OTLP when enabled
* `BRIDGE`: logging plus SQL storage, scheduled bridge uploads, and OTLP when enabled
If `metrics.mode` is `SQL` or `BRIDGE` but `metrics.destination` is missing,
Genesis keeps logging plus OTLP enabled when OTLP is configured instead of
turning metrics off completely.
`metrics.report_interval_s` controls the SQL exporter cadence. OTLP uses
its own `observability.metrics.export_interval_s` — the two can be set
independently.
### Managed deployment attribution
For managed installs, the control-plane installer sets `metrics.deployment_id`
to attach the deployment identifier to SQL-backed metric records as
`attributes.deployment_id` in `SQL` and `BRIDGE` modes. The setting is a string
that defaults to `""`; an empty value adds no attribute. It does not add the
identifier to `LOGS` metrics or OTLP output. Restart Genesis after changing the
setting.
## Cost reporting behavior
When Genesis renders LLM cost reporting, it uses the normalized usage fields
stored on assistant messages. Cache-aware models report separate `input`,
`output`, `cache_read`, and `cache_write` costs, and reported
`billable_input` excludes both `cache_read_input_tokens` and
`cache_creation_input_tokens`.
## Related pages
* [Tracing](/docs/Setup/Tracing) — OpenTelemetry distributed traces, configured the same way
* [Pulse Monitoring](/docs/User-Guide/Pulse-Monitoring)
* [Advanced Settings](/docs/Setup/Advanced-Settings)
## What customers configure here
* the metrics mode,
* destination or bridge settings,
* reporting interval,
* upload frequency,
* related metrics credentials or configuration values.
## Environment-specific behavior
Some deployments show additional instructions or approval actions when external metrics delivery requires extra configuration.
In Snowflake / SPCS bridge-mode deployments, the page can show
**Approve External Access** and **Assign to Genesis** controls for outbound
metrics delivery. After you trigger those actions, Genesis rechecks the
assignment immediately and updates the section in place as soon as the external
access integration is confirmed.
## OTLP export
Genesis can export metrics directly to any OpenTelemetry-compatible
collector — Prometheus, Datadog, Grafana Cloud, New Relic, Honeycomb,
Splunk Observability, OpenObserve, and so on — over the standard
OTLP/gRPC or OTLP/HTTP transports. This path is configured separately
from `metrics.mode`, so you can run OTLP on its own or alongside the
existing logs, SQL, or bridge pipeline.
### Configuration
| Setting | Type | Default | Description |
| - | - | - | - |
| `observability.metrics.enabled` | boolean | `false` | Enable direct OTLP metrics export. |
| `observability.metrics.protocol` | string | `grpc` | OTLP transport: `grpc` (default port 4317) or `http` (default port 4318, `/v1/metrics` path). Invalid values disable OTLP export. |
| `observability.metrics.endpoint` | string | `OTEL_EXPORTER_OTLP_ENDPOINT`, then `observability.tracing.endpoint`, then `http://localhost:4317` | OTLP endpoint URL. When set, this overrides the shared OTLP and tracing fallbacks. |
| `observability.metrics.headers` | string | empty | Optional comma-separated `key=value` header list passed to the exporter. Secret-backed values are resolved before export. See [Headers and authentication](#headers-and-authentication) below for the encoding rules. |
| `observability.metrics.export_interval_s` | integer | `30` | OTLP export interval in seconds. Invalid or non-positive values fall back to `30`. |
For `grpc`, Genesis performs a short startup availability check against
the configured endpoint before enabling OTLP export. If the collector is
unreachable, OTLP export is disabled cleanly and Genesis continues
running. Set `OTEL_METRICS_FORCE_ENABLE=true` only when you need to skip
that preflight (for example, when the collector starts after Genesis).
**Restart required.** All `observability.metrics.*` settings are read
once at startup. After changing any of them — including enabling OTLP
for the first time, swapping the endpoint, or rotating an auth header —
restart Genesis for the change to take effect.
### Headers and authentication
`observability.metrics.headers` follows the W3C OTLP header convention:
a comma-separated list of `key=value` pairs. The exporter
URL-decodes each value before sending, so any character that is awkward
to store in a flat config field (spaces, commas, `=`, etc.) must be
percent-encoded.
The single most common gotcha is the **space inside `Bearer ` tokens**:
the Genesis Secrets UI strips literal spaces from values to prevent
accidental copy-paste damage, so you must enter the space as `%20`.
| You want to send | Enter in `observability.metrics.headers` |
| - | - |
| `Authorization: Bearer eyJhbGciOi…` | `authorization=Bearer%20eyJhbGciOi…` |
| `X-API-Key: my-secret-key` | `x-api-key=my-secret-key` |
| Two headers at once | `authorization=Bearer%20,x-tenant-id=acme` |
| A value containing a comma | percent-encode the comma as `%2C` |
You can also store the entire header string in the **Secrets** panel
and reference it from `observability.metrics.headers` — the exporter
resolves secret-backed values before parsing.
### What gets exported
Every data point Genesis exports carries a global `instance` attribute
identifying the Genesis instance (set via `server.instance_name` or
`GENESIS__SERVER__INSTANCE_NAME`). The OpenTelemetry instrumentation
scope name is `genesis.metrics`. Counters are exported with **delta**
temporality (each export carries the increments since the previous
export, not a cumulative total). Gauges are sampled at export time.
Hosted Try Me instances also add a `tryme_instance` attribute to every
metric row, set to the instance's Fly app name. This is present when demo
mode and `demo.provisioner_url` are configured and `FLY_APP_NAME` is set;
it is omitted from laptop mode and other installations.
#### Gauges (point-in-time values)
| Metric | Unit | Attributes | What it measures |
| - | - | - | - |
| `ACQUIRED_SLOTS` | count | `instance`, `purpose` | Number of agent execution slots currently in use. Reported twice per tick: once with `purpose="*"` for the total, once with `purpose=""` for the per-purpose breakdown. |
| `FREE_SLOTS` | count | `instance`, `purpose="*"` | Number of agent execution slots still available (`max_slots − ACQUIRED_SLOTS`). |
| `WAITING_THREADS` | count | `instance`, `purpose` | Number of threads parked in the waiter queue because no slot was available. Reported twice per tick: total and per-purpose. |
`purpose` values: `user_chat` (interactive chat), `scheduled_job`
(scheduler-driven), `blueprint` (blueprint execution), `handoff`
(delegated work), `unknown`, or `*` (total across all purposes).
#### Counters (delta-exported)
| Metric | Unit | Attributes | What it measures |
| - | - | - | - |
| `MESSAGES_SENT` | count | `instance`, `bot_id`, `user_id` (hashed), `source` | User-initiated messages handed to a bot. `source` is `websocket` for interactive chat or `blueprint_start` for blueprint kickoffs. |
| `USER_ACTIVE` | count | `instance`, `tryme_instance` (hosted Try Me only), `user_id` (hashed), `auth_provider` | Activity tick when a person's last-login time is written on a hosted Try Me instance. Writes are throttled, so the count approximates active minutes rather than exact session duration. |
| `TOOL_CALLS` | count | `instance`, `tool_name`, `bot_id` | Tool invocations executed by the bot. `tool_name` is the canonical tool function name (e.g. `manage_context`, `search_threads`, `git_action`); `"unknown"` if it could not be resolved. |
| `LLM_CALLS` | count | `instance`, `model`, `provider`, `bot_id`, optional `execution_origin`, optional `credential_type` | LLM completion calls made by Genesis. |
| `LLM_PROMPT_TOKENS` | tokens | same as `LLM_CALLS` | Sum of input/prompt tokens consumed across LLM calls. The value includes cache-read tokens for all providers, including Snowflake Cortex. |
| `LLM_COMPLETION_TOKENS` | tokens | same as `LLM_CALLS` | Sum of output/completion tokens emitted by the model. |
| `LLM_CACHE_READ_TOKENS` | tokens | same as `LLM_CALLS` | Prompt-caching read tokens (cache hits — tokens billed at the discounted cache-read rate). Zero on providers without prompt caching. |
| `LLM_CACHE_CREATION_TOKENS` | tokens | same as `LLM_CALLS` | Prompt-caching write tokens (new cache entries). Zero on providers without prompt caching. |
| `LLM_CACHE_MISS_TOKENS` | tokens | same as `LLM_CALLS` | Prompt tokens in calls where the provider explicitly reports zero cache-read tokens. Missing or null cache-read values are not counted as misses. |
LLM counter attribute values:
* `model` — literal model string the request was sent with
(e.g. `gpt-5`, `claude-sonnet-4-6`, `cortex-claude-sonnet-4-6`);
`"unknown"` if the response did not include it.
* `provider` — `openai`, `anthropic`, `cortex`, `litellm_proxy`, etc.;
`"unknown"` if not reported.
* `bot_id` — agent identifier associated with the LLM call. Use this dimension
to attribute LLM usage and cache misses to a bot. Thread identifiers are not
exported as dimensions; per-thread cost remains in the thread's own
`thread_stats_v1` aggregate.
* `execution_origin` (only present for proxied / classified calls) —
for example `interactive_user`, `scheduled_background`,
`handoff_initiated`, `blueprint_runtime`. Lets you separate
human-driven cost from background-automation cost.
* `credential_type` (only present for proxied calls) — for example
`api_key`, `service_account`, `oauth_user`.
### Privacy
* **`user_id` is irreversibly hashed** before being attached to any
metric. Genesis generates a per-deployment salt the first time it
starts; your collector receives an opaque 32-character hex token, not
the raw user identifier. The salt never leaves the host.
* **No prompt content, completion content, or tool arguments** are
exported as metric attributes. Only metric values, counter increments,
and the attribute fields listed in the tables above.
* The `tool_name` and `bot_id` attributes are emitted as-is and may
appear in your collector. If you treat bot or tool names as
sensitive, scope your collector's data retention accordingly.
### Verifying it works
After enabling OTLP and restarting Genesis, look in the server logs at
startup for one of these messages:
| Log line | Meaning |
| - | - |
| `OTLP metrics export enabled: protocol= endpoint= interval=ms` | OTLP export is on. Data points should begin arriving at your collector within one export interval (default 30 s). |
| `OTLP metrics endpoint is not available; metrics OTLP export disabled` | The startup availability check failed. The endpoint is wrong, the collector is down, or the network path is blocked. Local SQL / bridge metrics continue working; only OTLP export is off until the next restart. |
| `OTLP metrics enabled but no endpoint configured; export disabled` | `observability.metrics.enabled=true` but no endpoint resolved. Set `observability.metrics.endpoint` (or one of the documented fallbacks). |
| `Invalid observability.metrics.protocol ''…` | `observability.metrics.protocol` is something other than `grpc` or `http`. |
When endpoints are logged, Genesis automatically strips credentials
(`user:pass@`) and query tokens from the URL before logging, so it is
safe to share these log lines for troubleshooting.
### Thread health probe log lines
Genesis emits single-line `THREAD_HEALTH_PROBE` records in server logs to
correlate slow threads without enabling debug tracing. Search logs for that
prefix, then filter by `phase=`:
| `phase` | When emitted | Typical use |
| - | - | - |
| `prep_start` | Before the model call, after prompt assembly | Pre-LLM prep drift, cache misses, large payload assembly |
| `llm_end` | After a model call completes | End-to-end LLM latency and token usage for one turn |
| `compression` | After a compression pass | Context saturation, no-op compressions, summary fallback usage |
| `adjacency_repair` | When orphan tool rows are dropped or synthesized | Repeated tool/adjacency repair on a thread |
| `ws_sender_slow` | When resolving the latest message sender for WebSocket delivery exceeds the hot-path threshold | Activity-path slowness under load |
Each line uses stable `key=value` segments (for example `thread_id`, `bot_id`,
`compression_event_count`, `dur_ms`). Values with spaces are JSON-escaped.
Thread message reads also emit `THREAD_MESSAGES_FETCH` records. The `import_ms`
field reports the worker's import duration in milliseconds to one decimal place;
it is `-` when that timing is unavailable or invalid. The record also includes
snapshot, formatting, RPC, and total-duration timings when available.
### Suggested first dashboards
| Dashboard panel | Metric(s) | Group by |
| - | - | - |
| Concurrent agent utilization | `ACQUIRED_SLOTS{purpose="*"} / (ACQUIRED_SLOTS{purpose="*"} + FREE_SLOTS{purpose="*"})` | `instance` |
| Capacity saturation | `WAITING_THREADS{purpose="*"}` | `instance` |
| Workload mix | `ACQUIRED_SLOTS{purpose!="*"}` | `instance`, `purpose` |
| Per-bot message volume | `rate(MESSAGES_SENT[5m])` | `instance`, `bot_id` |
| Daily active users (anonymized) | `count_distinct(user_id)` on `MESSAGES_SENT` over 24h | `instance` |
| Daily active Try Me users (anonymized) | `count_distinct(user_id)` on `USER_ACTIVE` over 24h | `tryme_instance` |
| Top tools by call rate | `rate(TOOL_CALLS[5m])` | `tool_name` |
| LLM spend by bot | `rate(LLM_PROMPT_TOKENS + LLM_COMPLETION_TOKENS)` × per-model unit price | `bot_id`, `model`, `provider` |
| Prompt-cache savings | `LLM_CACHE_READ_TOKENS / LLM_PROMPT_TOKENS` | `model` |
| Prompt-cache miss rate by volume | `LLM_CACHE_MISS_TOKENS / LLM_PROMPT_TOKENS` | `bot_id`, `model`, `provider` |
| Interactive vs background cost | `LLM_PROMPT_TOKENS + LLM_COMPLETION_TOKENS` | `execution_origin` |
## Metrics-mode combinations
When OTLP export is enabled, Genesis combines it with the selected
`metrics.mode` instead of replacing that mode:
* `DISABLED`: OTLP only
* `LOGS`: logs plus OTLP
* `SQL`: logging plus SQL storage, and OTLP when enabled
* `BRIDGE`: logging plus SQL storage, scheduled bridge uploads, and OTLP when enabled
If `metrics.mode` is `SQL` or `BRIDGE` but `metrics.destination` is missing,
Genesis keeps logging plus OTLP enabled when OTLP is configured instead of
turning metrics off completely.
`metrics.report_interval_s` controls the SQL exporter cadence. OTLP uses
its own `observability.metrics.export_interval_s` — the two can be set
independently.
### Managed deployment attribution
For managed installs, the control-plane installer sets `metrics.deployment_id`
to attach the deployment identifier to SQL-backed metric records as
`attributes.deployment_id` in `SQL` and `BRIDGE` modes. The setting is a string
that defaults to `""`; an empty value adds no attribute. It does not add the
identifier to `LOGS` metrics or OTLP output. Restart Genesis after changing the
setting.
## Cost reporting behavior
When Genesis renders LLM cost reporting, it uses the normalized usage fields
stored on assistant messages. Cache-aware models report separate `input`,
`output`, `cache_read`, and `cache_write` costs, and reported
`billable_input` excludes both `cache_read_input_tokens` and
`cache_creation_input_tokens`.
## Related pages
* [Tracing](/docs/Setup/Tracing) — OpenTelemetry distributed traces, configured the same way
* [Pulse Monitoring](/docs/User-Guide/Pulse-Monitoring)
* [Advanced Settings](/docs/Setup/Advanced-Settings)